Spot the Turn: Systematic Signals for Potential Reversals
Replace guesswork with reproducible turning point signals
Intro
I posted some conflicting FX signals a week ago and was asked the question. Are these turning points? Internally I thought possibly, however, that’s 1 a weak answer and 2 disingenuous at best. Why is it weak? Well I have no proof other than just conflicting signals. How did these perform in the past when they conflicted as such. I didn’t know. 2, it’s disingenuous to give an answer that you are not sure of and have nothing to back it up. Therefore, I started thinking, what would be a solid methodology to determining what should be considered a turning point? What should the Trend Signals and Strengths be? Lastly, I thought about what the results of this study could potentially be.
Thinking about it more in depth, it’s very ripe for cheating. I.e. seeing the results and then optimizing to make the turning points look better in sample and then be useless out of sample. Therefore, I said the results are the results. I will not alter anything, let’s see what comes out.
Methodology
First, for a robust methodology we need something that is not up to interpretation. It needs to be the same every time regardless of anything happening or what we think. We need something that makes logical sense. Therefore, this is our methodology for what will be considered potential turning points.
Trend Signals
A potential turning point needs to have as follows:
Trend Scores
-4 Short Term Trend and +4 Intermediate Term Trend or
+4 Short Term Trend and -4 Intermediate Term Trend
Why? The reason here is simple and therefore I think logical. Let’s observe the first. The reasoning here is I think that turning points will happen at points where we have strong trends on an intermediate term basis and then weakness on the short term basis. This will signify a potential extreme within the existing trend and give us a flag for something to look at.
Now this is a double edged sword to some extent. It is because it could not be a turning point in the sense where the trend is over and you want to get out. It could end up being a turning point for it to rip higher or lower.
Therefore, we only classify the former as a turning point. The latter is ignored as then we set up a can’t lose and we want to make robust models. We also will classify Trend Strength as well.
Trend Strength
The Intermediate Term Strength can’t be -4 or 4.
Why? I chose this because I think it’s unlikely to have turning points when Trend Strengths are so strong. If in fact we get anything here it is more likely short bursts of potential mean reversion. Therefore, the trend strength’s can’t be -4 or 4. Any potential turning points will be ignored if strength is that strong.
That’s all for methodology. We can go further, but personally I want something easy and simple to understand. Possibly we take this further, however, like I said this is very dangerous on something like this, we need to be very calculated and reasoned.
Asset Universe
The assets chosen here are the same that we have Trend Scores, Strengths, Breakout/Down and Mean Reversion Signals for. Furthermore, they are similar to the assets traded in the EW Managed Futures Strategy, Mean Reversion, and other Managed Futures Strategies we don’t share yet here.
The Universe is as Follows :
GLD TLT EWJ EEM EMB IEF IEV SPY USO FXY FXF FXE FXC CPER SLV CORN SOYB WEAT CANE UNG MCHI FXA FXB UGA
Importantly, we see that most of the more important and influential markets are included here. We have a robust set of FX, Hard, Soft, Bonds, Equities, markets here. I use futures for everything under hood, however, I share the Etf’s instead as I feel it’s easier for people to track and watch than looking at futures.
Make Up
I will not be sharing the make up of the various signals nor the math behind them. I know that in most research papers this is where they will do that. I won’t as of course that gives away edge.
Results
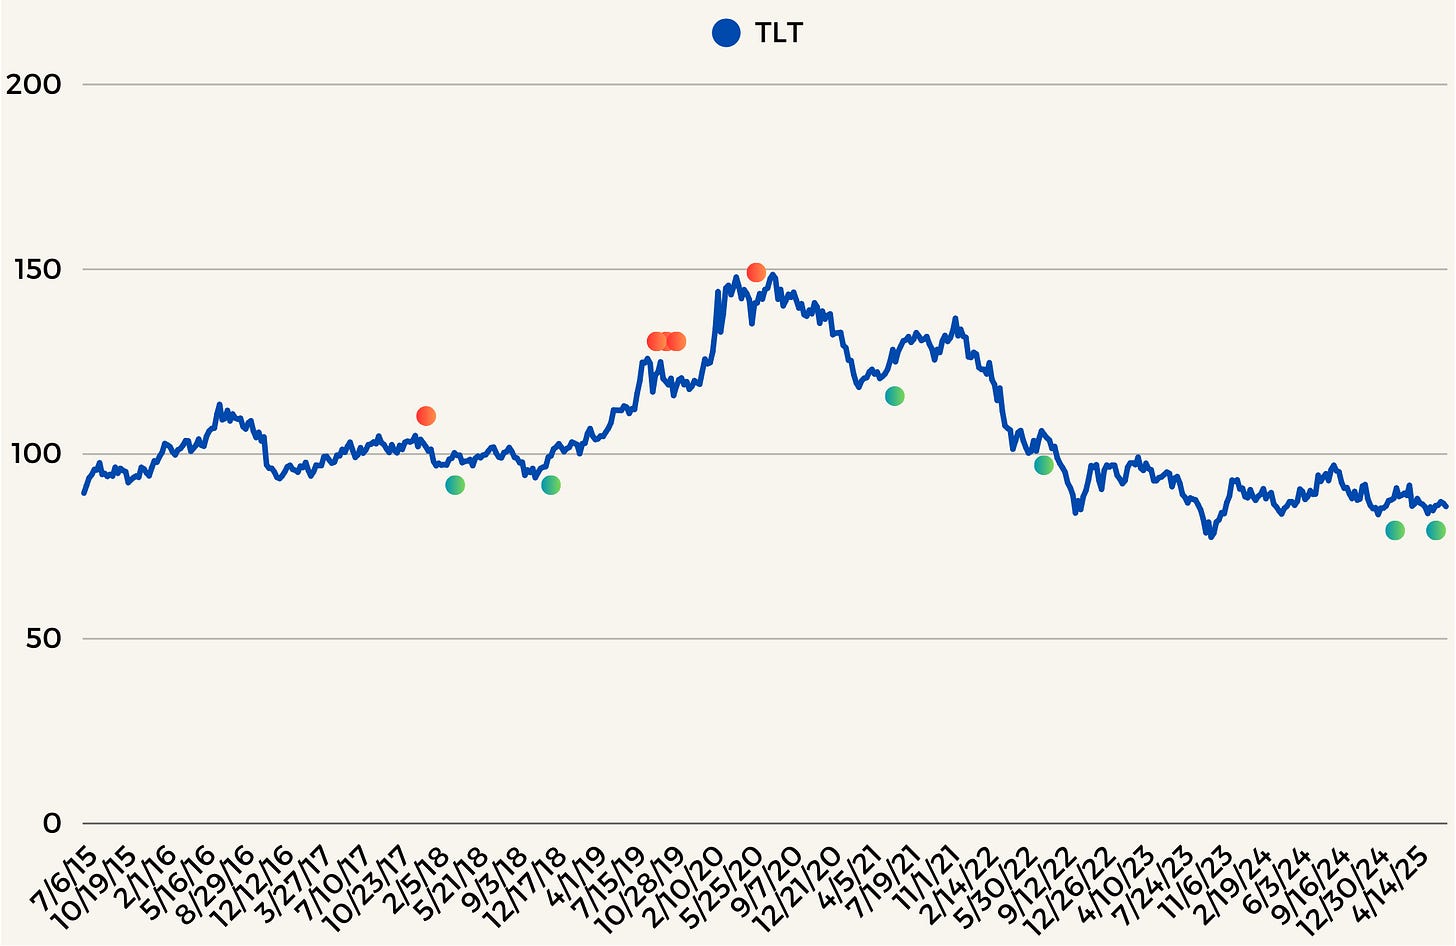
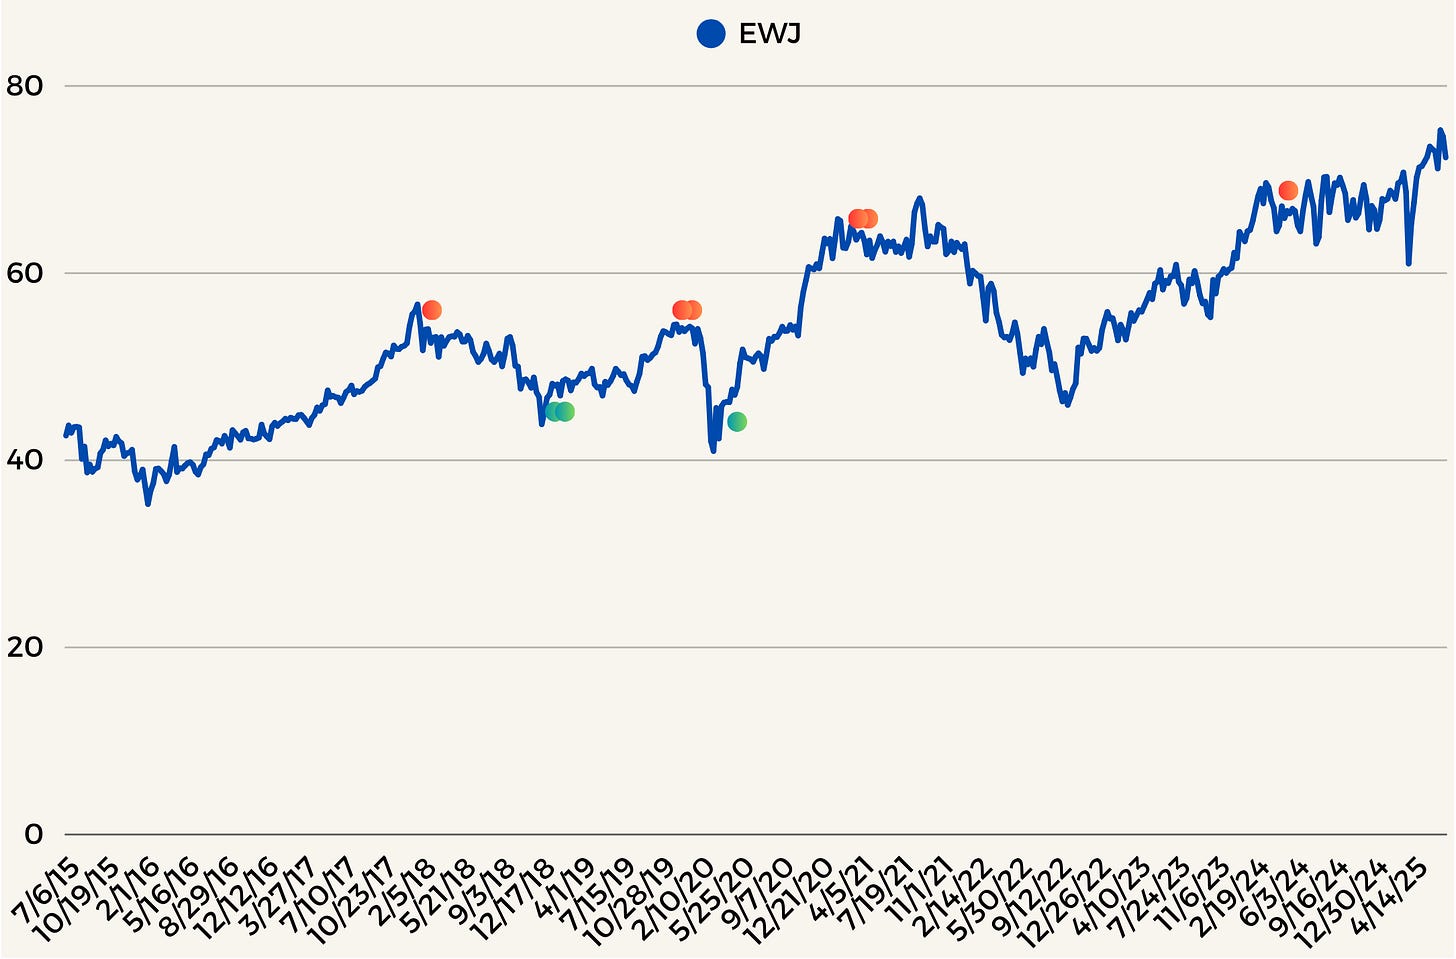
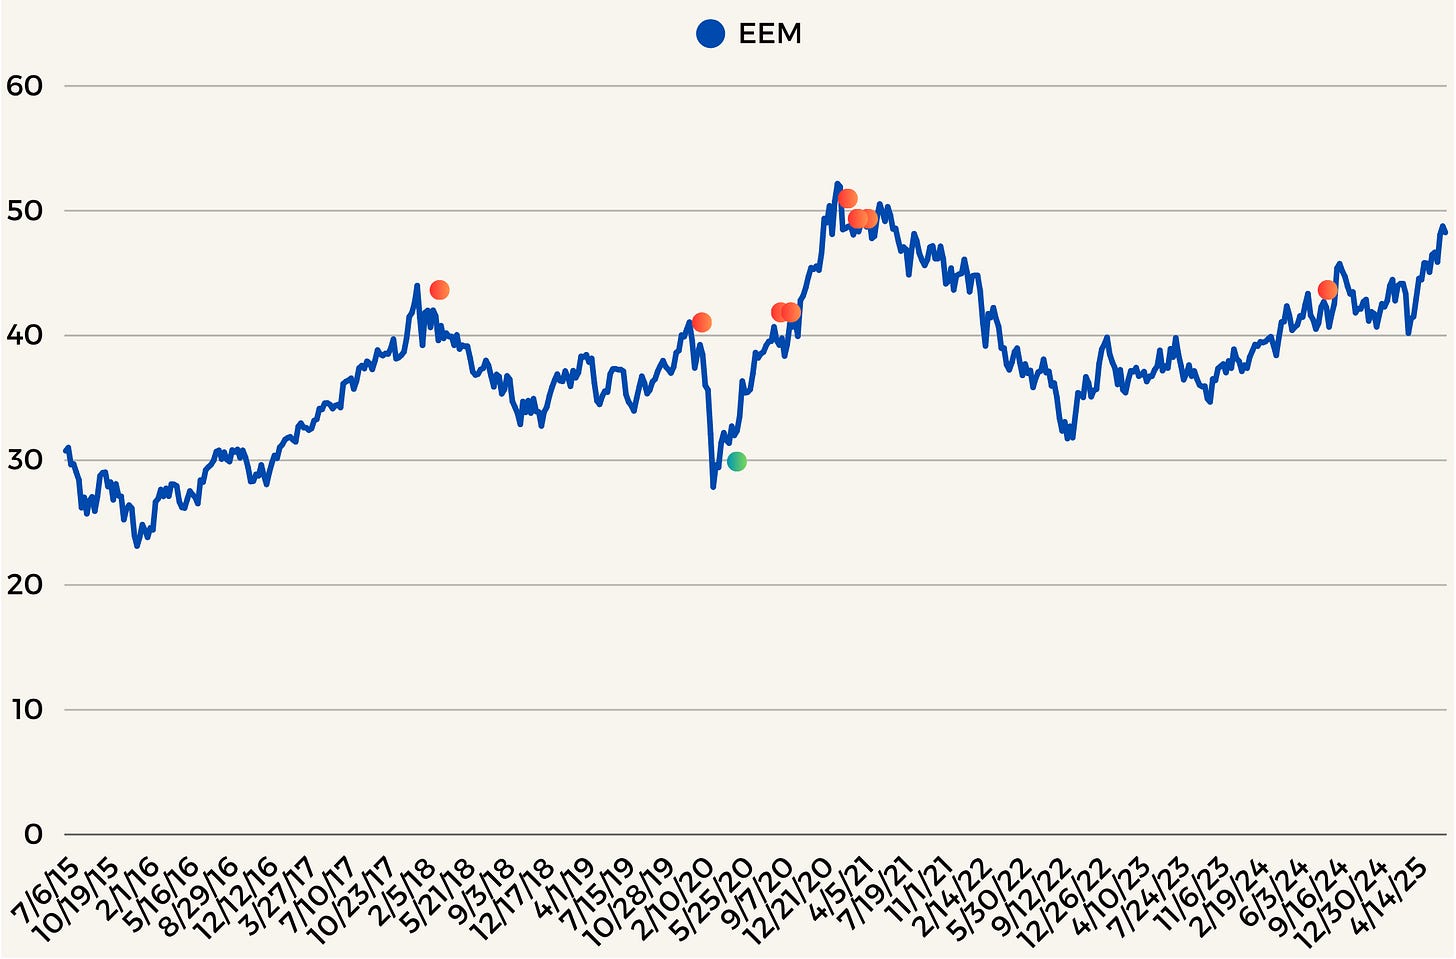
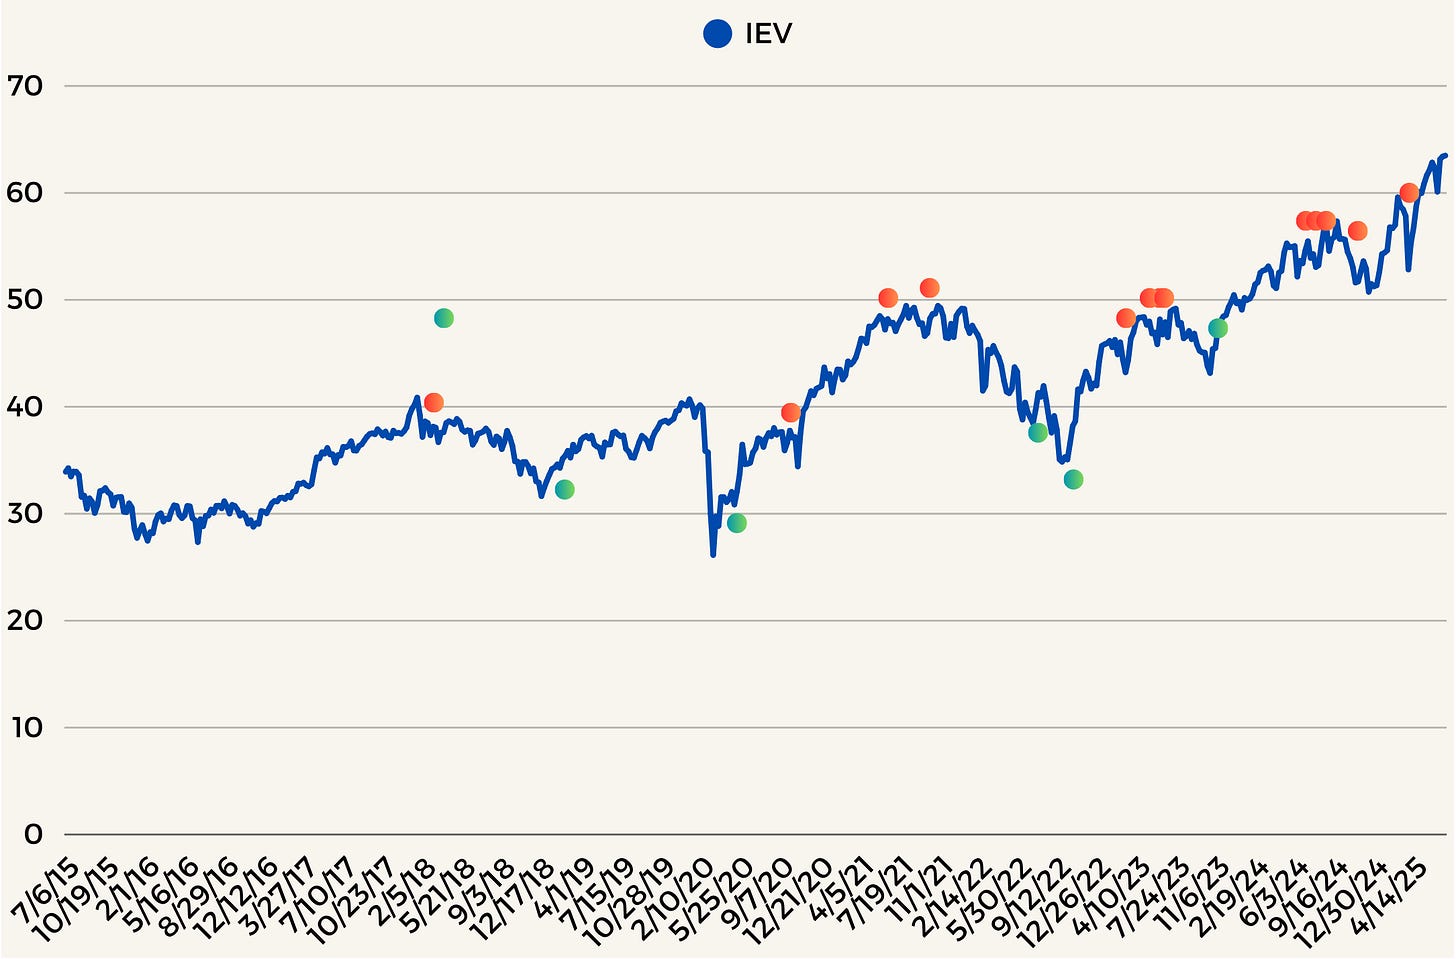
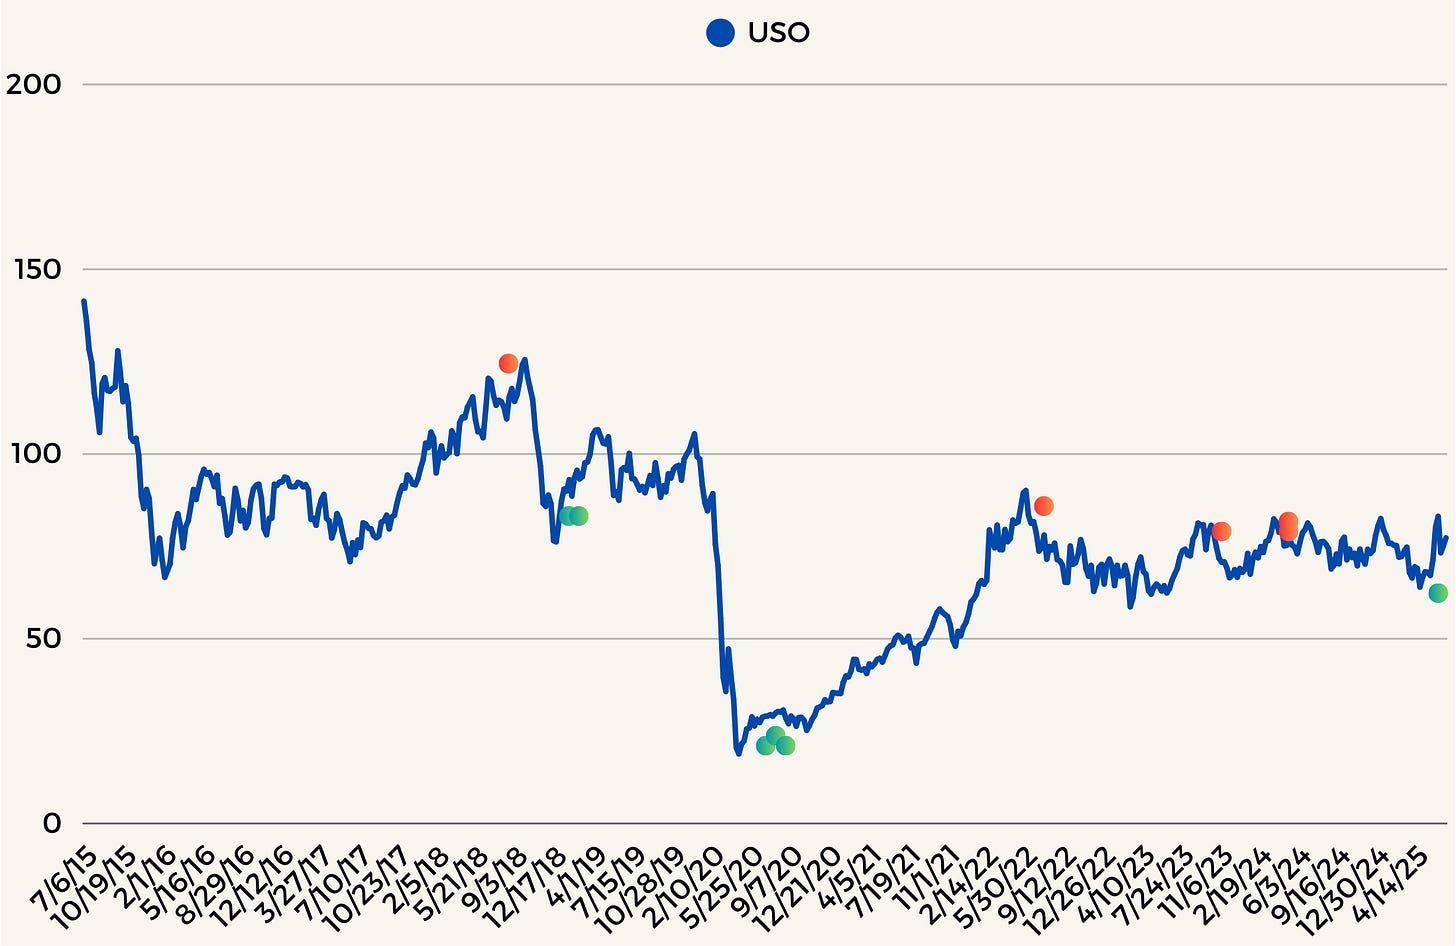
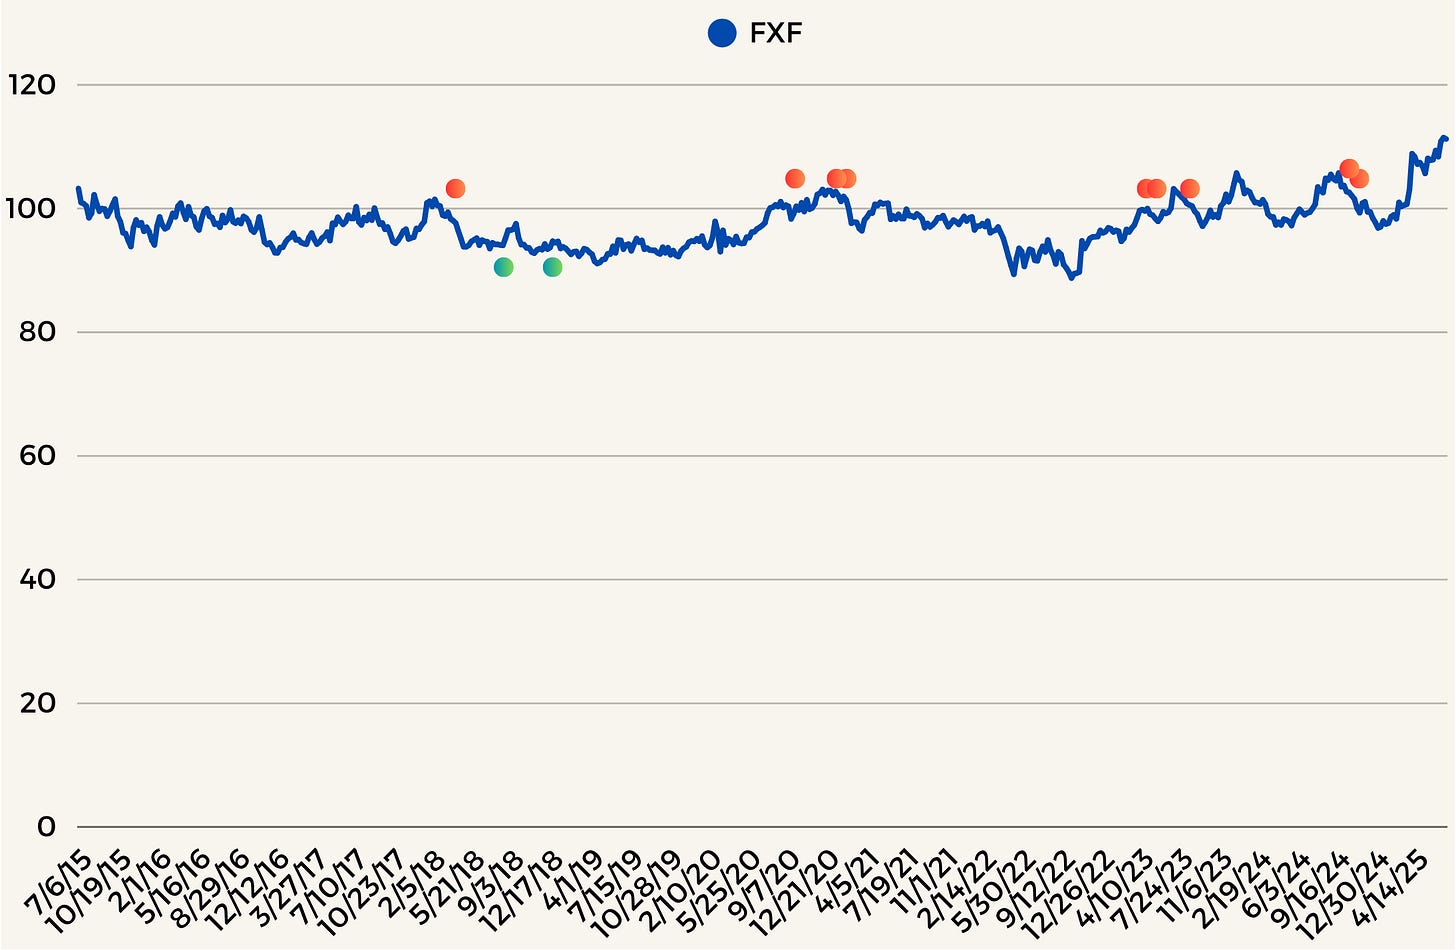
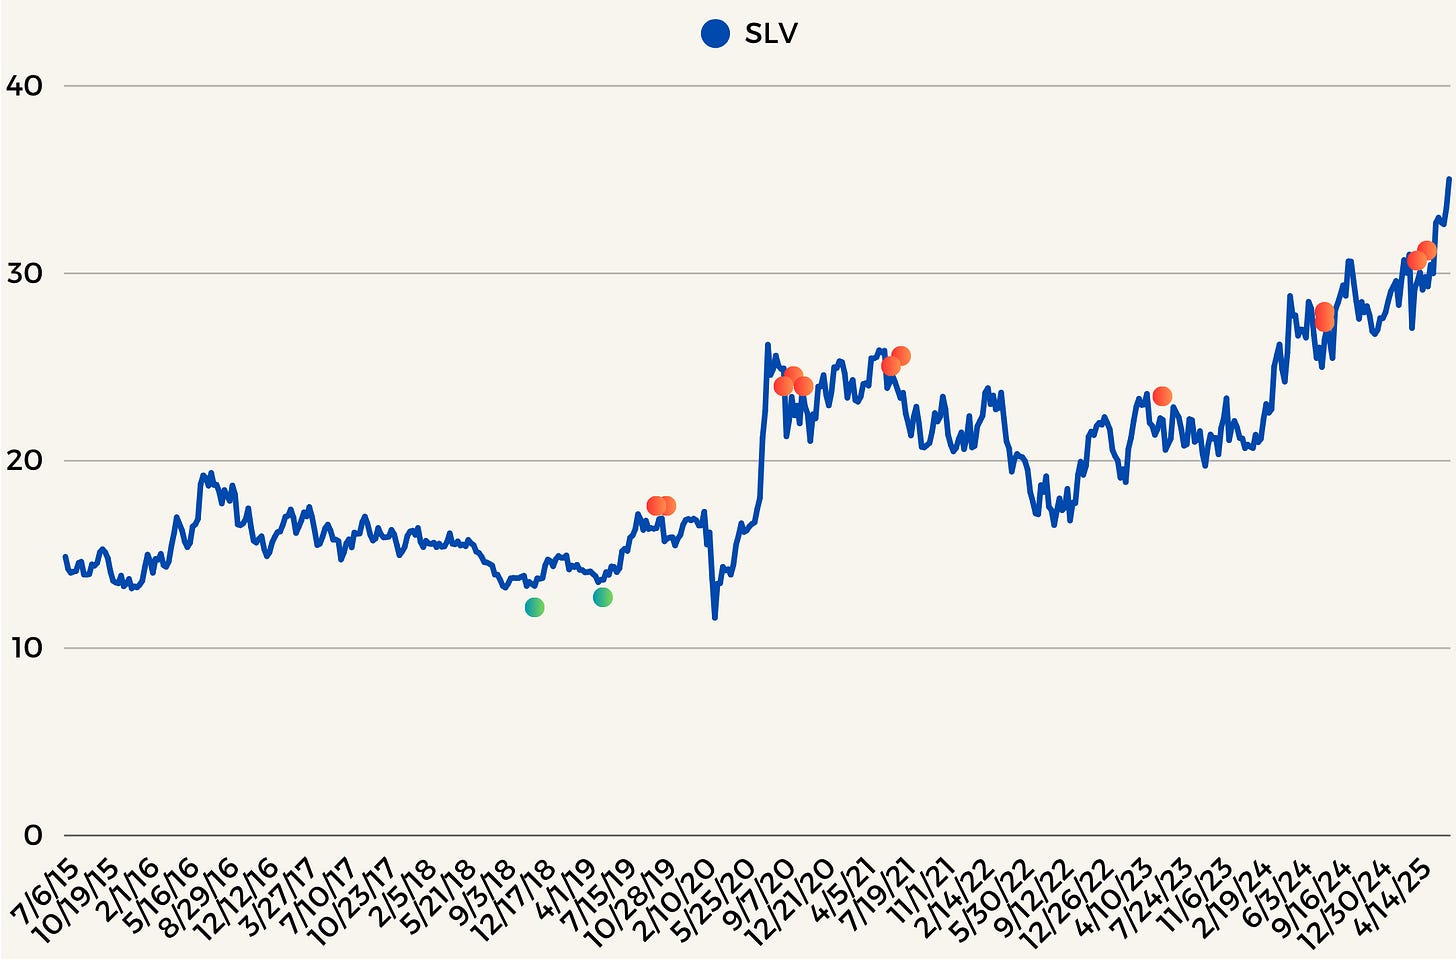
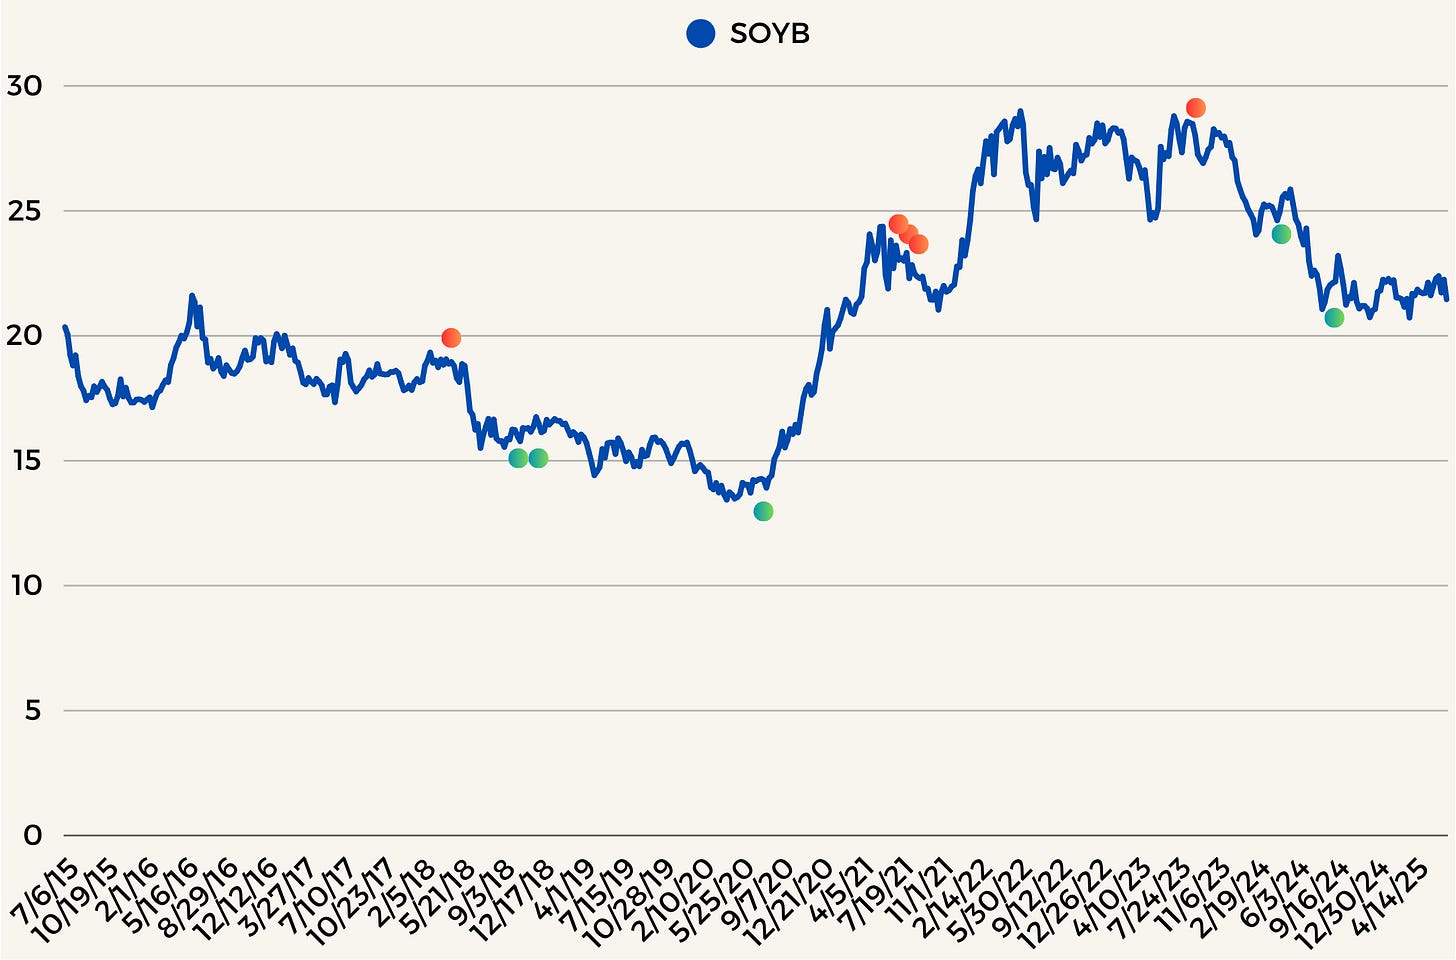
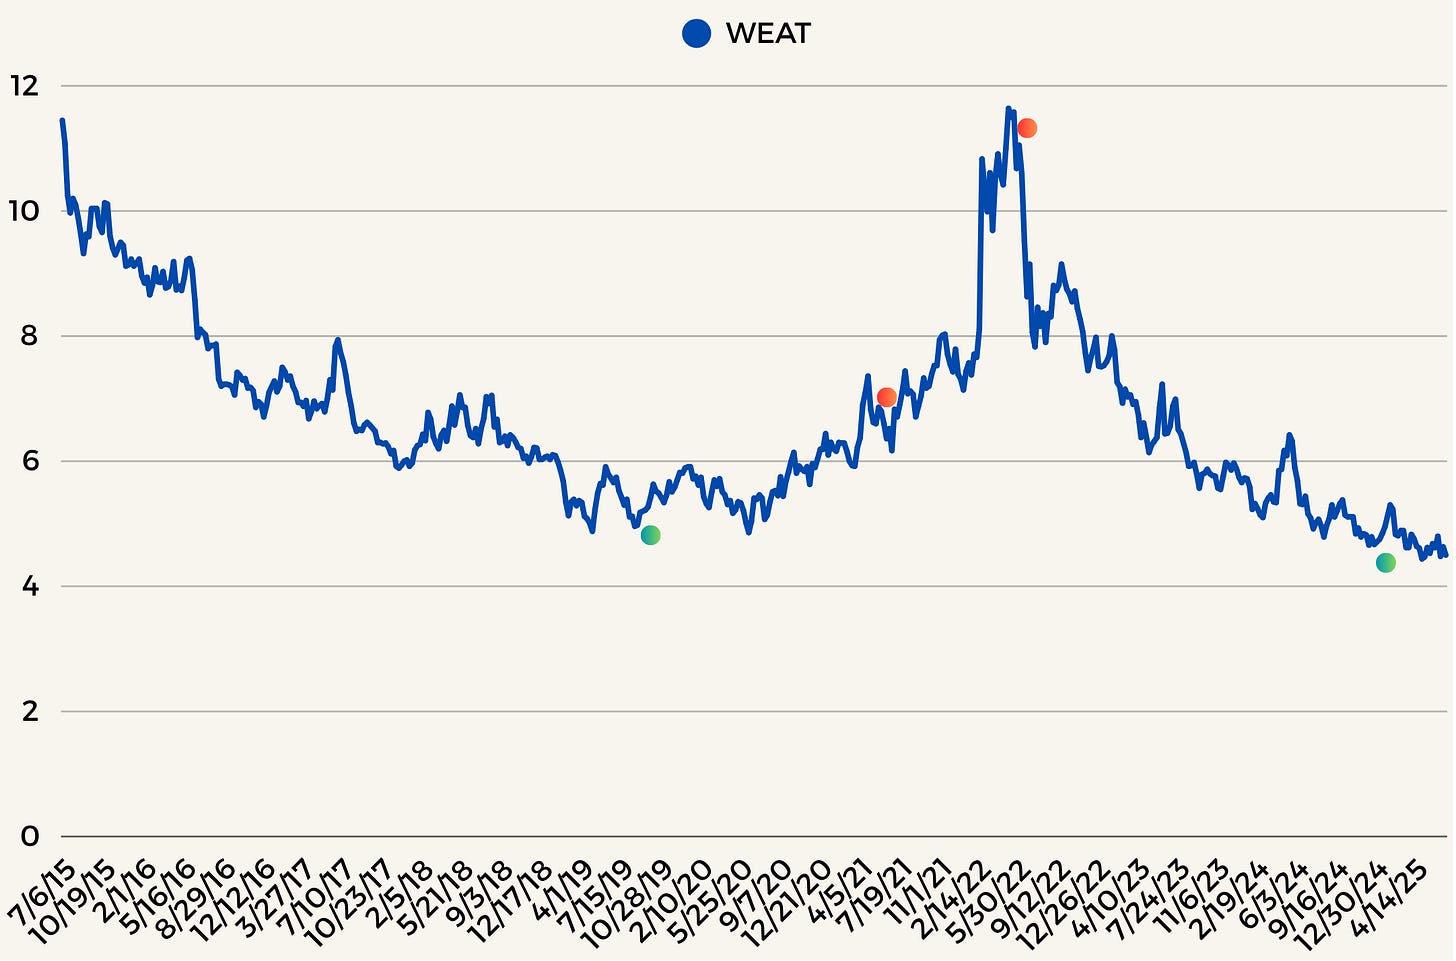
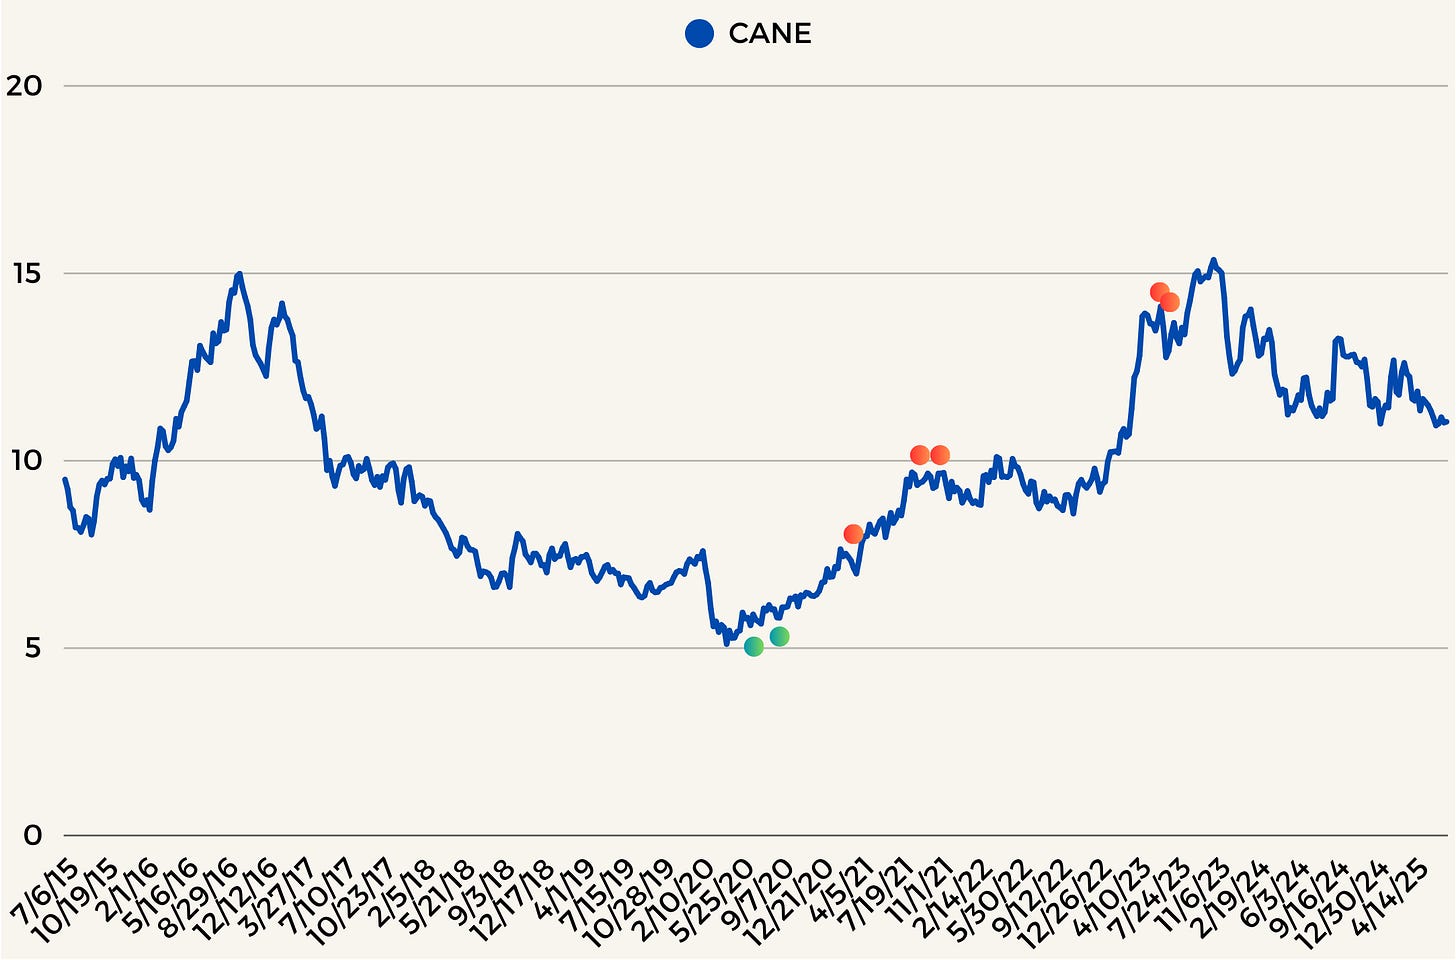
I will post the charts for each asset below. A simple legend :
Red Circles means a turning point that got classified due to a -4 Short Term Trend and a +4 Interm Trend as well as the Strength’s which we discussed above. Here we would anticipate a turning point which brings us lower.
Green Circles is the opposite of the Red Circle. Here we would anticipate a turning point which brings us higher.
If you made it down here you actually looked at all the charts and the results. Thanks! I’ll let you form your own opinions regarding the results above, then I will share mine.
My Thoughts
The first thing I thought when I looked at the results was remember when I said I thought we may get two things. The first being that we may see turning points in which an existing trend reverses. The other was I thought we may see existing trends reverse and then make new highs or lows from the turning points.
That’s essentially what we ended up seeing here. I would say that the former occurs more than the later however and we do end up seeing more trend reversals, than trend continuations. Therefore, I think the results are quite interesting.
I find the S&P 500 interesting as well in the fact that the results show that yes we do have some turning points where we did reverse, however, most the dips were just bought and we continued higher. Showing the buy the dip has been around longer than I felt like it has.
Any Trade Implementations?
Here again I will say I just don’t know. Looking at the results in none pretty chart form, I think taking concentrated positions based on these “Turning Points” would be unwise. Sometimes as you can see they don’t occur immediately. Maybe you’re thinking what about reducing some positions based on them? Again I’m not sure, because if we take any positions based on these we need a signal to say to use when that has failed. I’m not sure what that signal would be. I have ideas, however, there’s nothing factual behind the ideas here.
The one thing I would consider more logical would be using options on the signals. Anytime I buy Hedge Options I expect them to expire worthless. Therefore, I think using that as a methodology for potential trade implementations could be interesting as we would buy the options and if they’re worthless at the end, fine. We do have the question then of what expiries, strikes, etc. That’s for another day though.
How I Would Use These
Well for me I’d use them as big warning signals, they will tell me hey! Pay attention here, something’s happening. We will either get a reversal of the existing trend or we’re entering a period where that existing trend will continue higher. The former more than the later, however. I think that’s really the way at the moment to use these. Use them for added color on your views, ideas, or positions. Know that they mean something and you should be paying extra attention to that specific asset class as well as the other ones that generally have implications for the others.
For example, maybe we don’t get any Turning Point signals of Gold. However, maybe we get Turing Point signals on FX where they Dollar may start reversion the downward trend. This isn’t always the case btw. However, there is a strong historical connection between the Dollar and Gold. Therefore, I’d be watching Gold as well due to those other related Turning Points.
Alright I Caved
I figured before getting to the end of this, it would be half assed if we at least didn’t try some strategy methodology. Like I said I don’t think I’d necessarily invest in a strategy like this, and I think it’s more for potential added color of existing positions. However, let’s assume a simple methodology. Let’s just assume we take long or short positions based on the turning points signals we get and then just hold those positions for 4 weeks. Then after 4 weeks close the positions. Why pick 4 weeks? Well logically 2 weeks wouldn’t be enough for a turning points signal to get going. Then longer than 4 weeks we may be setting ourselves up for just luck.
Therefore, I picked 4 weeks. I am aware a better approach would be to pick various time frames and either blend them all together or show the results separately. However, this is already quite long and I’ll do that in another article.
Overall, I’d say if we were to allocate to this, I wouldn’t. However, the more interesting dynamic here could be adding it as part of another strategy. The correlations show interesting metrics around stress market points and I find that a potential benefit to this. I’ll leave you with this, not every strategy needs to look good in back tests. If it looks to good, it’s most likely bs. Sometimes the ones that look the most uninspiring are the most intriguing ones to add to a Multi Strategy.
Thanks
Thanks for reading these and maybe forgiving some weird ways of writing. I am new to this and I already only sleep 4-5 hours per night so sometimes things become a bit blurry. I appreciate your interest and I hope there’s some value I deliver for you all.


