
Demystifying Mean Reversion, How to Define it, Use it and Why
Discover the advantages of mean reversion strategies and how to integrate them into your existing book or use them alone. A systematic approach included

Intro
Every signal spoken about or referenced below is available on my site caltropia.com in real time to see and run a Mean Reversion Strategy like shown and discussed below easily yourself.
Prior to creating my own Mean Reversion Signals and strategy, I researched Mean Reversion. First, there’s not much of real actionable value I found. Some were some studies, but they seemed like overly complex statistical Mean Reversion. Maybe they would work out of sample, however, I didn’t want to recreate them, even with ChatGpt. Second, the other stuff was mostly inactionable Substack articles that wouldn’t work great in real world investment and playing mean reversion off one atr or bol band is pretty useless. Maybe I’m not any better, but I believe I can show you some value and how to use the mean reversion signals I give for free to deliver actionable value and give you proof of that value.
Mean Reversion
We all know what this means, but quickly, I have two strategies and mean reversion models. Therefore, I define it based on those. The first is mean reversion within a managed futures book. I don’t define it as something that has gone too far up or down. Idk what that value would even be. What we want here isn’t something that’s up or down a lot, or the rate of change of it going up or down. We want signals independent of that.
We already know that things going up will generally continue and vice versa. We want signals that say this is potentially either going to slow down its descent/ascent or reverse it.
For instance, sometimes we’ll have mean reversion not trigger even if something is up a lot or down lot. Take GOOGL for example. It was down around -21% from Feb 4 25 - Mar 18 25. No mean reversion triggered. However, on Mar 28 it did trigger about -3% lower and would have still triggered even if at the same price as Mar 18.
The second use of mean reversion is an independent strategy from the managed futures one. This runs on a similar methodology, however, in this we aren’t just trying to reduce weightings of existing assets, we’re investing directly in the signals. Here mean reversion signals have a greater significance because we don’t have offsetting positions if they are wrong. Different methodologies are therefore important in this strategy to protect that fact.
Signals
I’ll be clear, I won’t give you the math and what my signals are based on. That wouldn’t be wise. However, I will give you the signals which is just as good if not better. Why recreate when they can be given to you right.
The signals are all on my site Caltropia.com and available by signing up for free. They are focused around what’s traded in the EW Managed Futures Book as well as the other Managed Futures Books and thus also what the Mean Reversion Book is trading too.
Below is a quick video what they look like, and before you view it a quick overview.
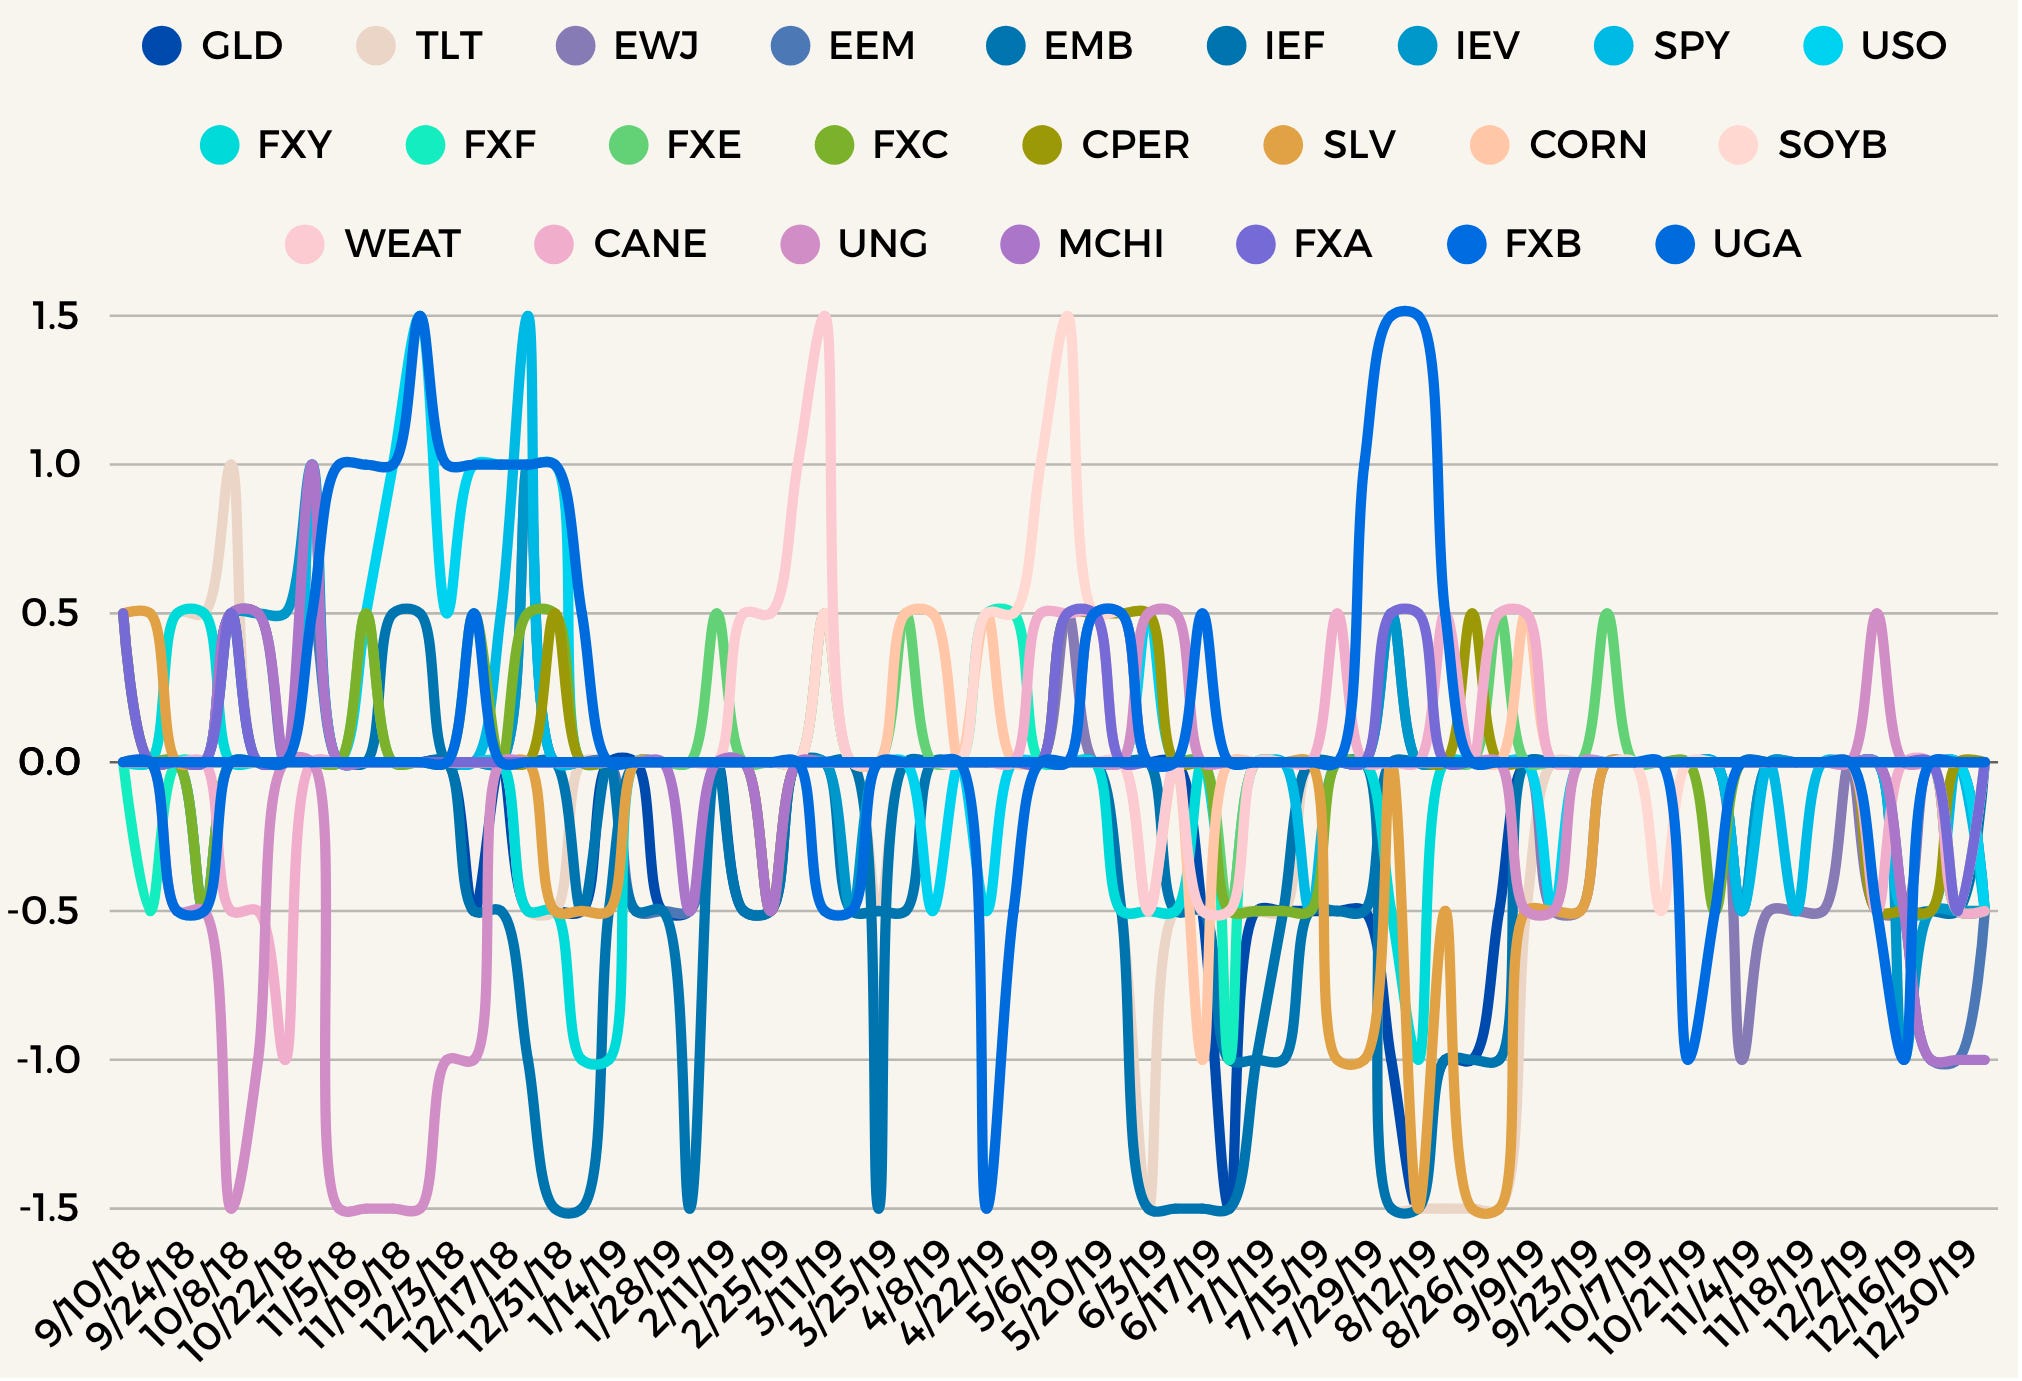
Overview Signal Values
If negative that means the signals think the price will revert down.
If 0 nothing of interest.
If positive that means the signals think the price will revert up.
-1.5
-1
-0.5
0
0.5
1
1.5
These values are important, and I will show how we utilize these in the context of both books described above and how you can easily utilize them as well.
Utilization within EW Managed Futures Book
We have gone over how we utilize these within the EW Managed Futures Book before, however, let’s just review it again.
Let’s assume for simplicities sake, we have 5 assets. GLD, TLT, EWJ, EEM, and EMB.
The weights again for simplicity sake are as follows -
GLD 5%
TLT -5%
EWJ -5%
EEM 5%
EMB 5%
Also assume the following Mean Reversion Signals -
GLD -1
TLT +1
EWJ +0.5
EEM -1.5
EMB 0
What do we do? Let’s look at the reduction and increase multipliers
+ or - 0.5 = .15 Multiplier
+ or - 1 = .20 Multiplier
+ or - 1.5 = .25 Multiplier
0 = No Multiplier
Multiplier Adjustment
GLD 5% Weight -1 Signal : 5% x .20 = 1% Reduction to 4% Overall Weight
TLT -5% Weight +1 Signal : -5% x .20 = -1% Reduction to -4% Weight
EWJ -5% Weight +0.5 Signal : -5% x .15 = -0.75% Reduction to -4.25% Weight
EEM 5% Weight -1.5 Signal : 5% x .25 = 1.25% Reduction to 3.75% Weight
EMB 5% Weight 0 Signal : No Change, Still 5% Weight
Final Book Rebalance
GLD 5% to 4%
TLT -5% to -4%
EWJ -5% to -4.25%
EEM 5% to 3.75%
EMB 5% (No Change)
Results
I know some or most will be asking themselves, big deal, 1% changes sometimes more, or little less. That can’t possibly move the needle much. First, sure, but keep in mind we’re starting at 5% weights here. In the real world we aren’t. Generally these weights can be as high 15% on the long side, or -15% on the short side. That does make a larger difference to overall potential changes.
However, you don’t need to take my word for it. Let me show you the impact and benefits of including a Mean Reversion Strategy within our EW Managed Futures Strategy.
EW Managed Futures Strategy Higher Volatility (HV) without and with Mean Reversion Overlay
We use the higher volatility one to exhibit the changes a bit more.
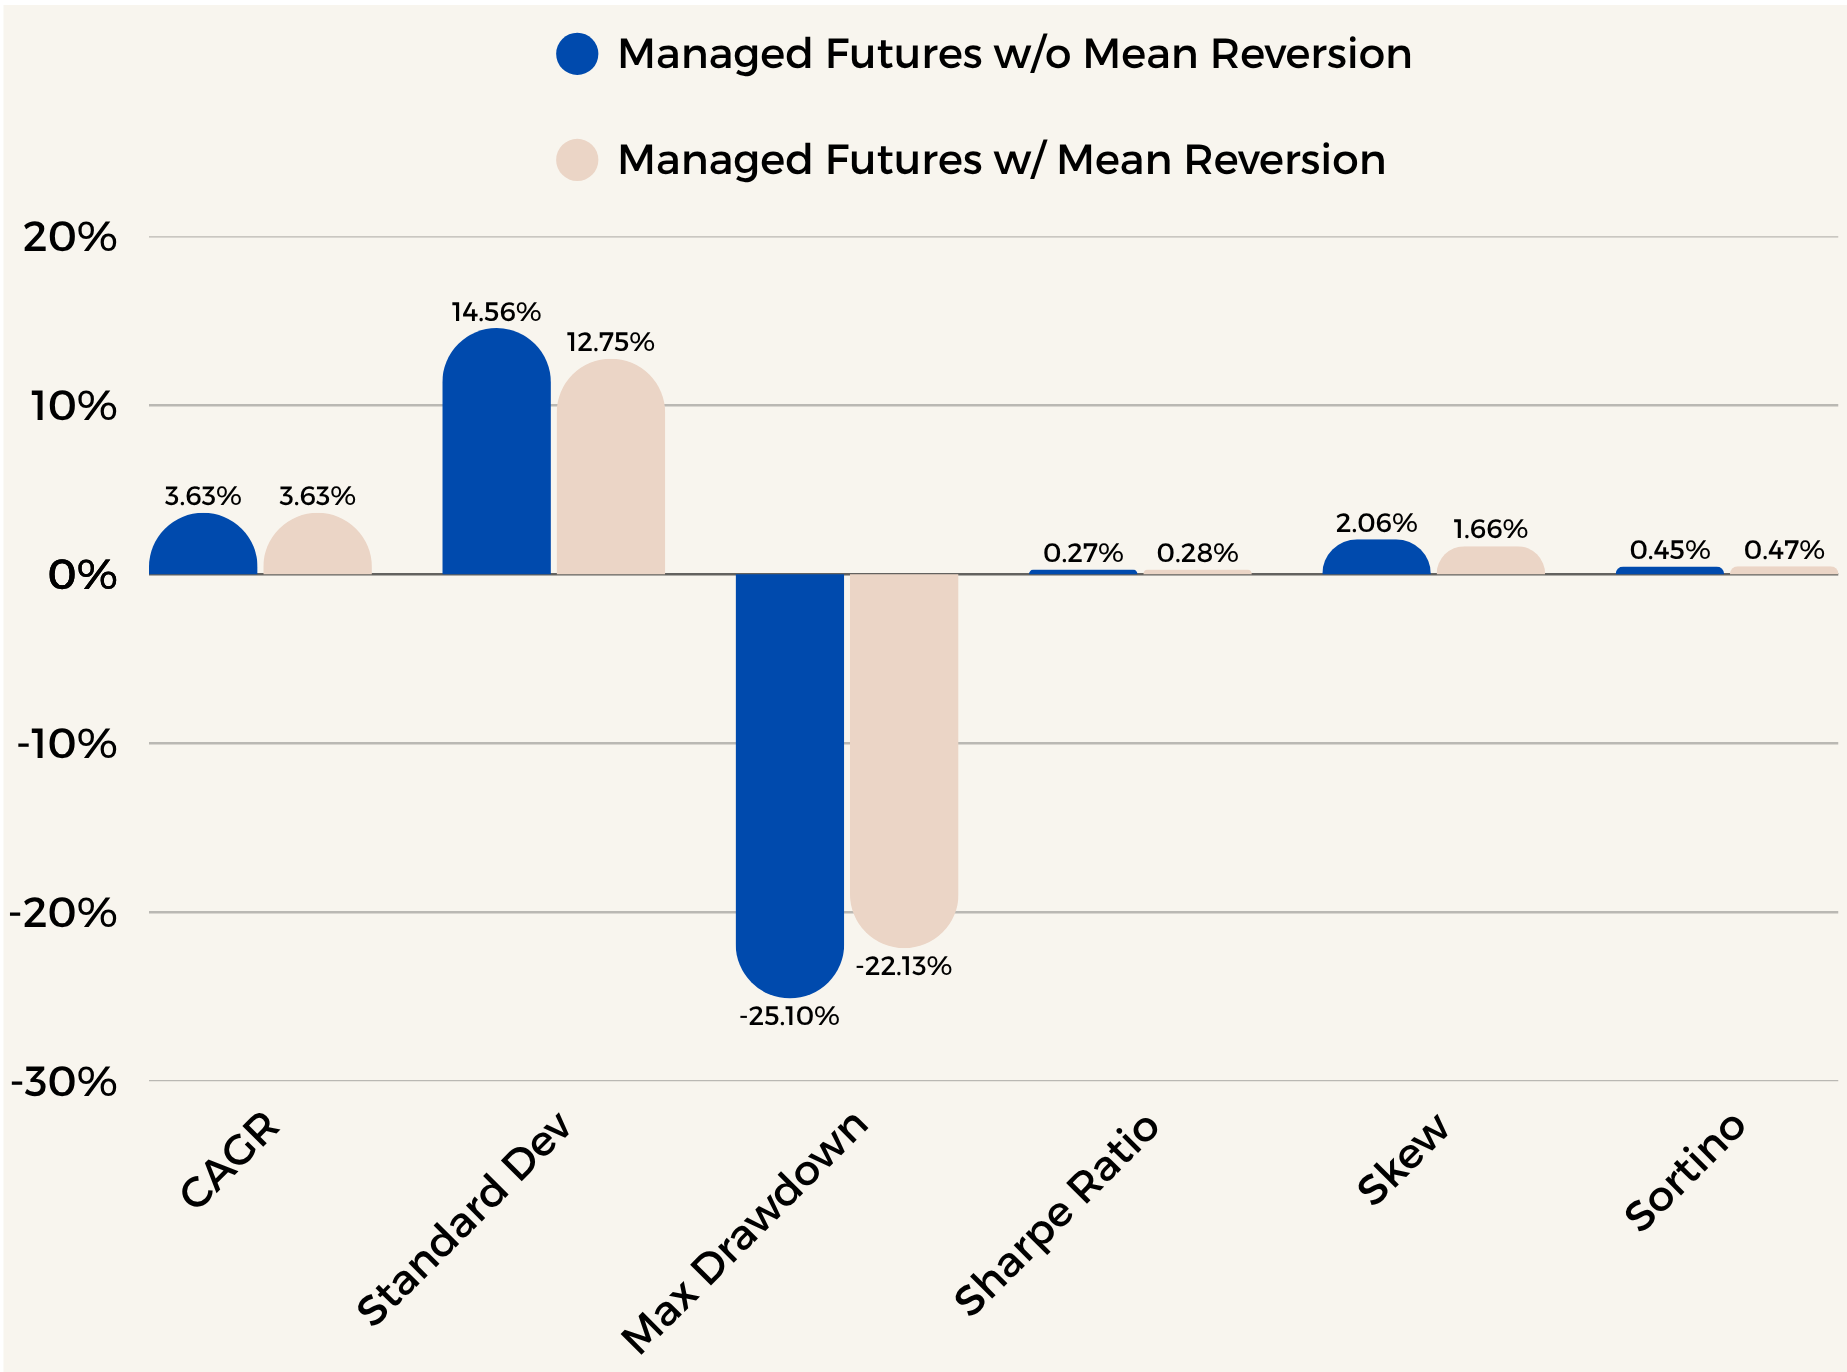
The first, the blue is without Mean Reversion and the second the beige is with Mean Reversion overlay. We are using the exact same methodology as above for reduction and increasing of weights. If for instance we increased those multipliers we would see an even larger change. However, I don’t like to tinker and then generate curve potential curve fitting. This works, and even at small multipliers shows the benefits of the overlay. We can see the benefits immediately. Same returns, lower vol, smaller drawdown, a bit higher Sharpe, less skew (makes sense, I’ll discuss later). This is exactly what we would want going into looking at these.
Let’s now get into the signals and what it’s doing and when. I’ll pick a random point in time with the signals so we can overlay them on a chart. Otherwise, it will be difficult to see and interpret what we’re looking at with so many signals for different assets.
Here’s the thing, I don’t want to have this trading daily. 1. It’s too many transactions and the costs associated with that I don’t think would be worth it. 2. I’d rather have a slower than very fast strategy that waits a little bit longer to make decisions on the signals and makes sure they’re a bit sticky prior to entry. What we do instead is simple and also easy to follow so don’t worry. I like things complicated, but in action simple.
If at the end of the trading week, the signal is still there, we take the overlay multiplier position. If not, we leave it until it shows up again. Simple. I want something easy to follow and implement for other people too. That’s easy enough and simple enough to understand as well. The overlay reduction or increase will come off on its own if it does revert because come rebalance time there’s no signal anymore, and the short term trend scores and strengths will have been reduced, thus reducing the position and also taking off the Mean Rev Multiplier. If it continues to not revert the signal will most likely, not always, but generally stay on and increase depending on what the signal started with for instance. I.e. -0.5 to -1 and then to -1.5. If that happened the multiplier would continue to increase as seen above.
I now want to show you the two strategies compared to each other. The Man Futs with Mean Reversion and the Mean Reversion Strategy independent of it.
Managed Futures EW w/ Mean Reversion Overlay vs Independent Mean Reversion Strategy Only
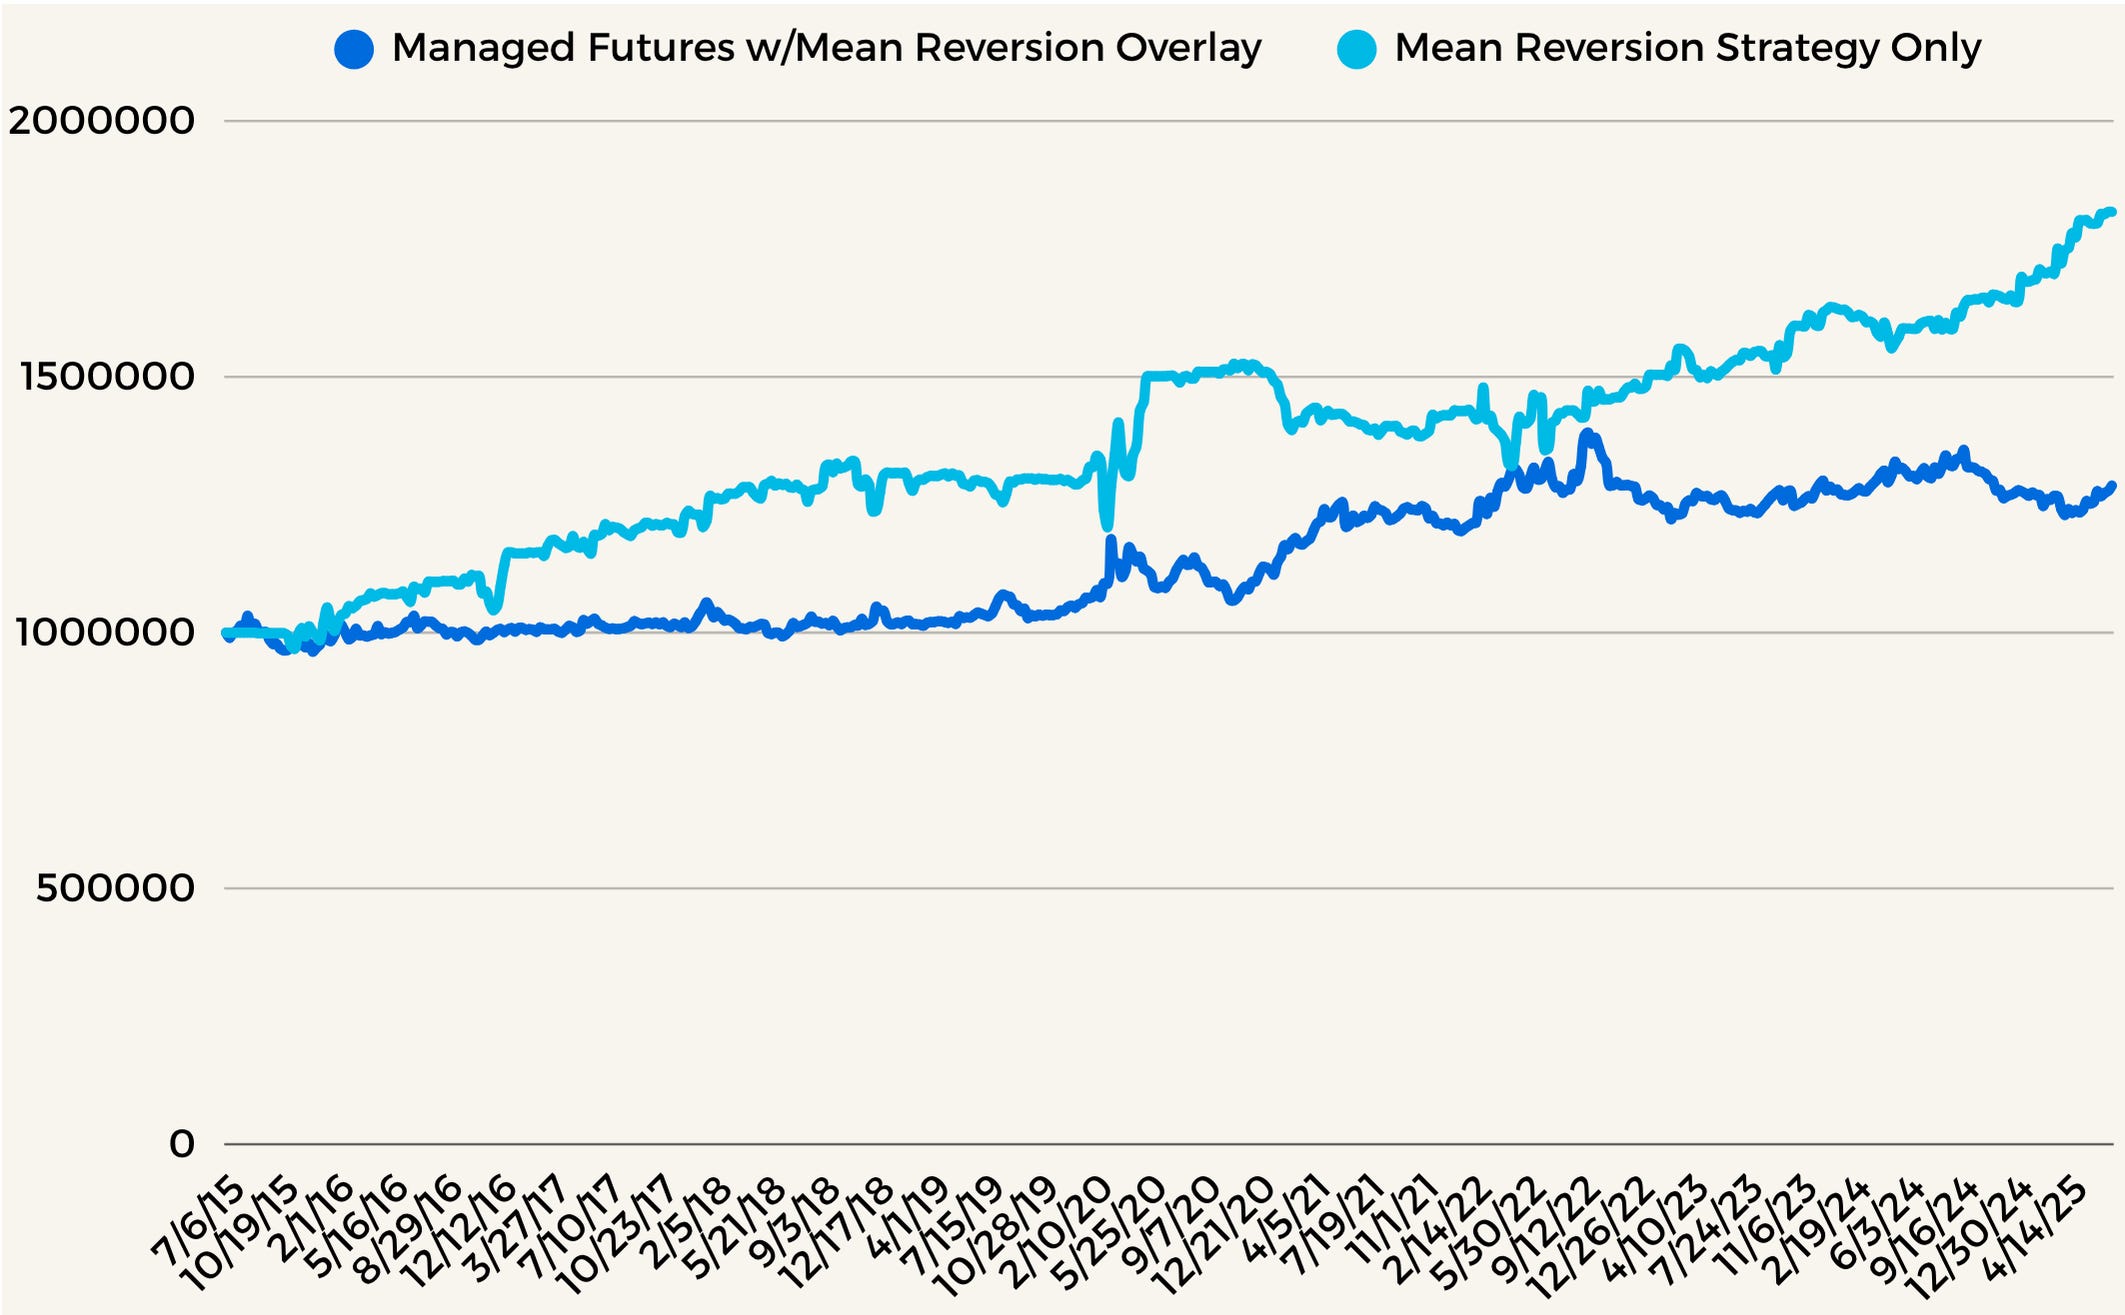
Let’s look at the above chart together. First thing to note, The Managed Futures Strat already has the Mean Reversion overlay implemented. Therefore, the negative correlation between the two doesn’t look as strong.
We can clearly see evidence of a negative correlation between the two. Sometimes stronger, sometimes less so and more stable. However, the link is evident. This is exactly what we want.
Therefore, what happens when we have this overlay? What do you think should or would happen?
Since we’re taking contrasting positions against our existing book, or just more easily reducing or increasing existing weights this should reduce volatility, and furthermore, it should decrease skew as well.
Why decrease skew? We hope in any good Managed Futures Strategy that we have positive skew, essentially more months that are higher up than negatively down. Our Strat has a high positive skew. Therefore, when we’re taking Mean Reverting positions we are going directly against momentum. We hope that every signal works, however, we don’t have 100% hit rate, and that will of course decrease our upside or downside momentum reducing positions into that. Therefore, reducing our skew. If we have a 15% position and we reduce it to 11% and the position still rises, we still make money, however, we make less. That’s the reduction in skew.
Let’s now take a closer look at the correlations between the two strategies over time. What we want is a low correlation between the two and that is exactly what we achieve.
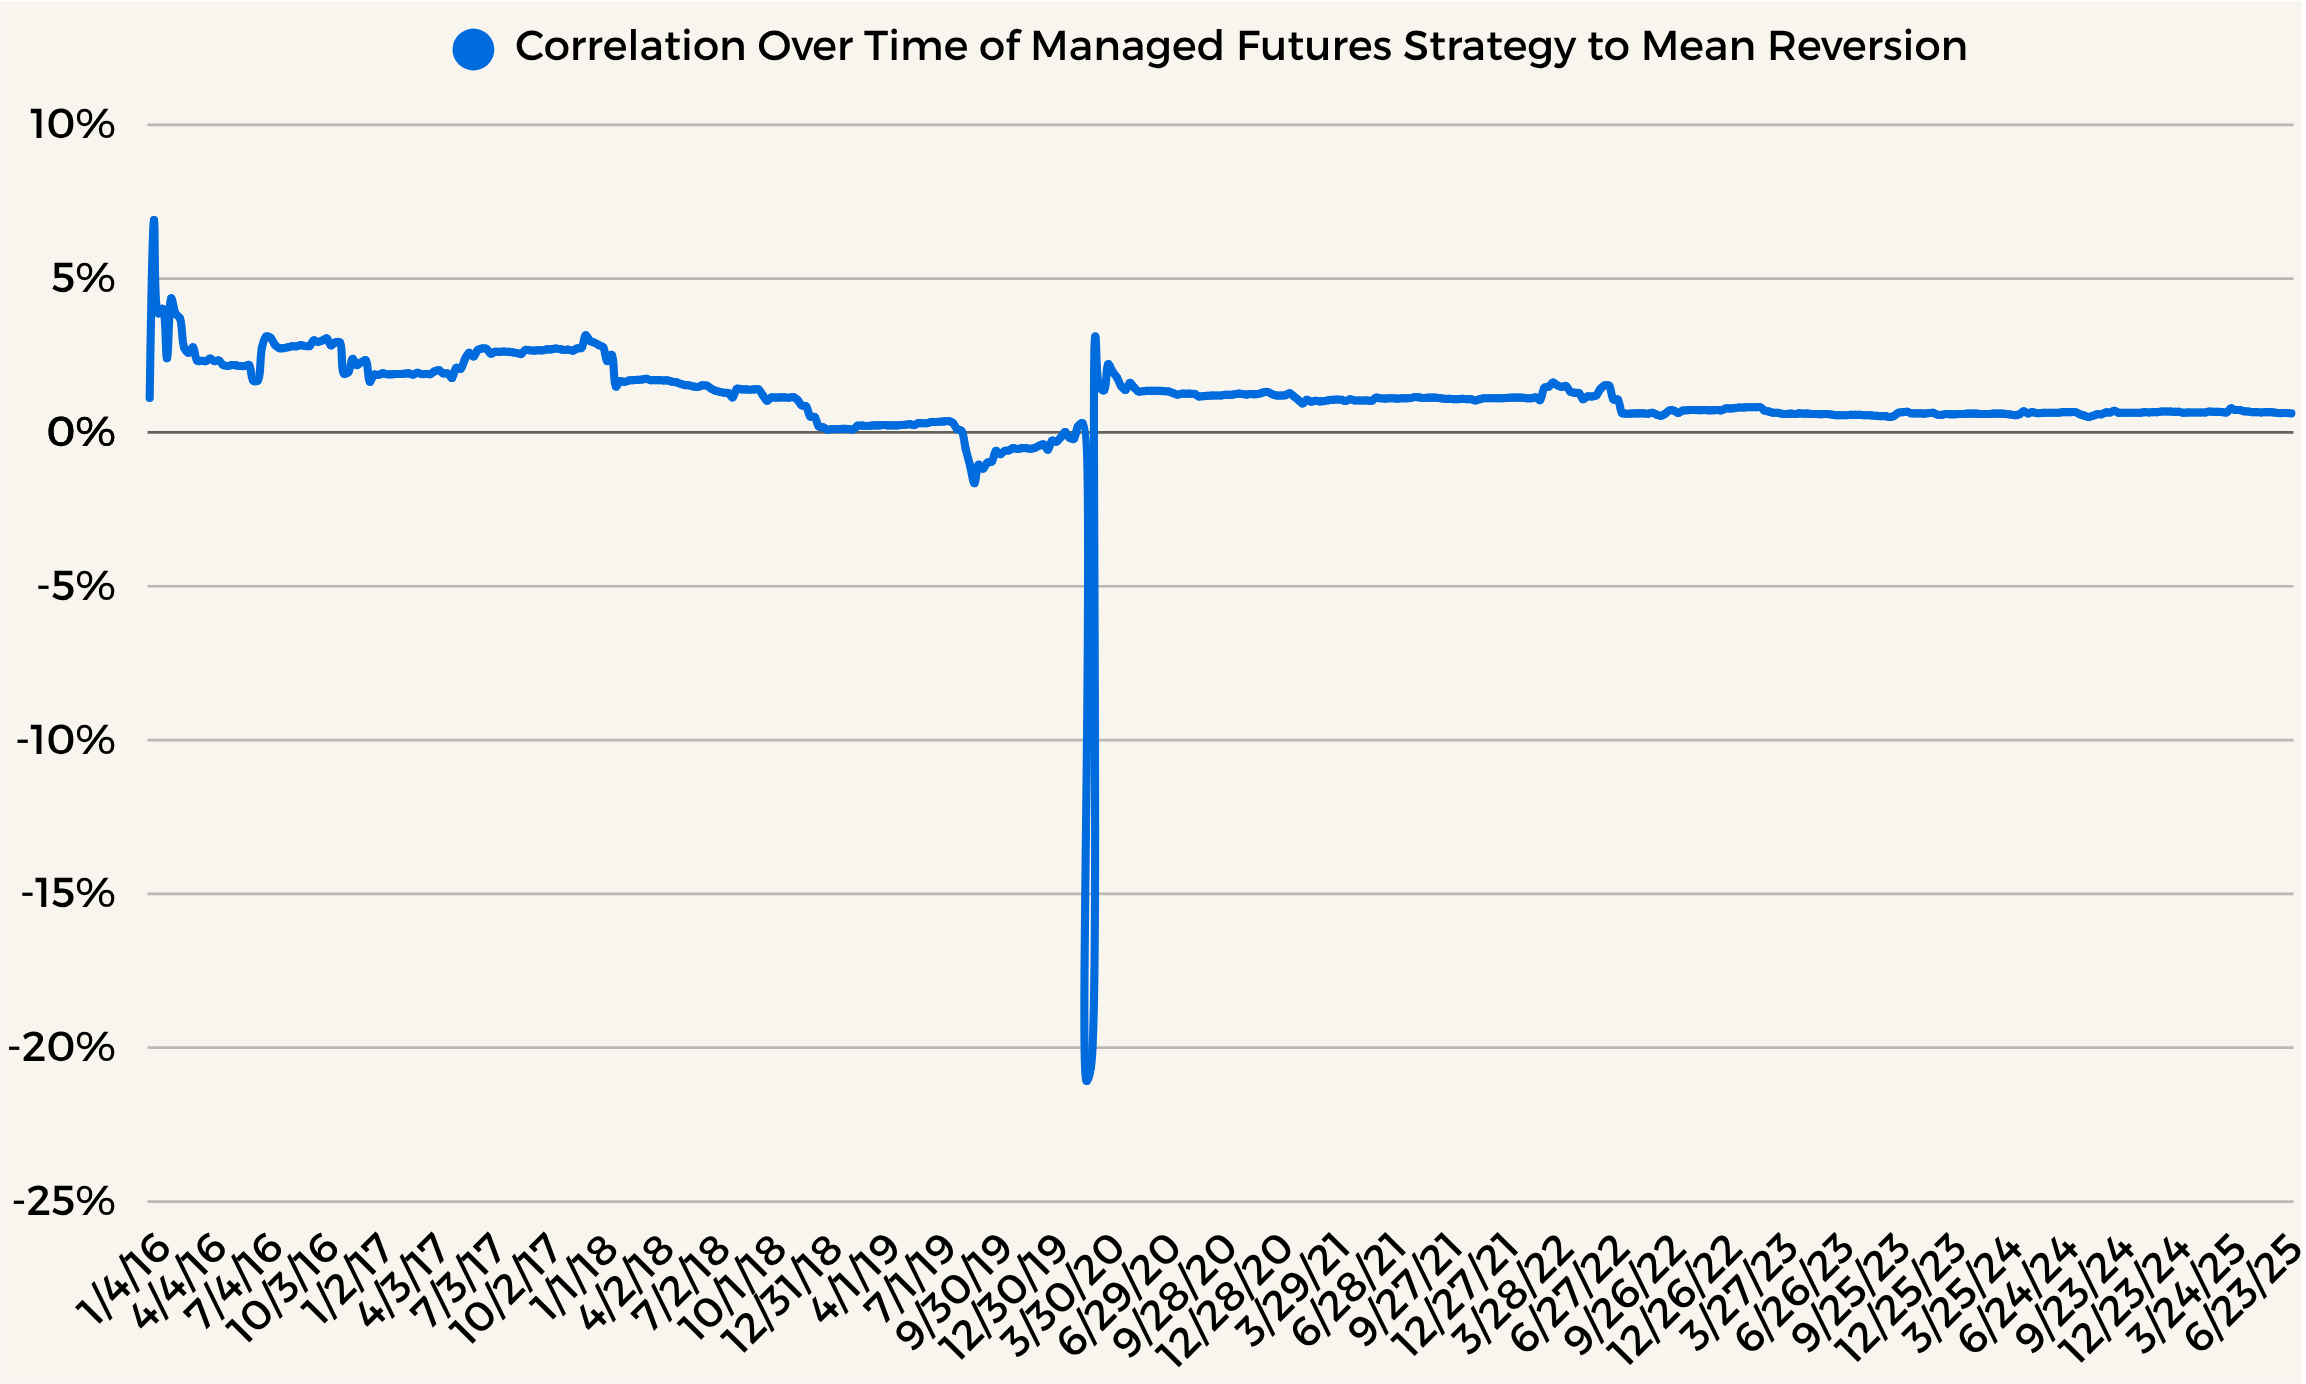
Over time the correlations are essentially never over 5% and if we did correlations between the Managed Futures Strat without Mean Reversion overlay, we would see correlations firmly in the negatives throughout this time period. Therefore, this is further confirmation that this is an effective overlay to add to our book.
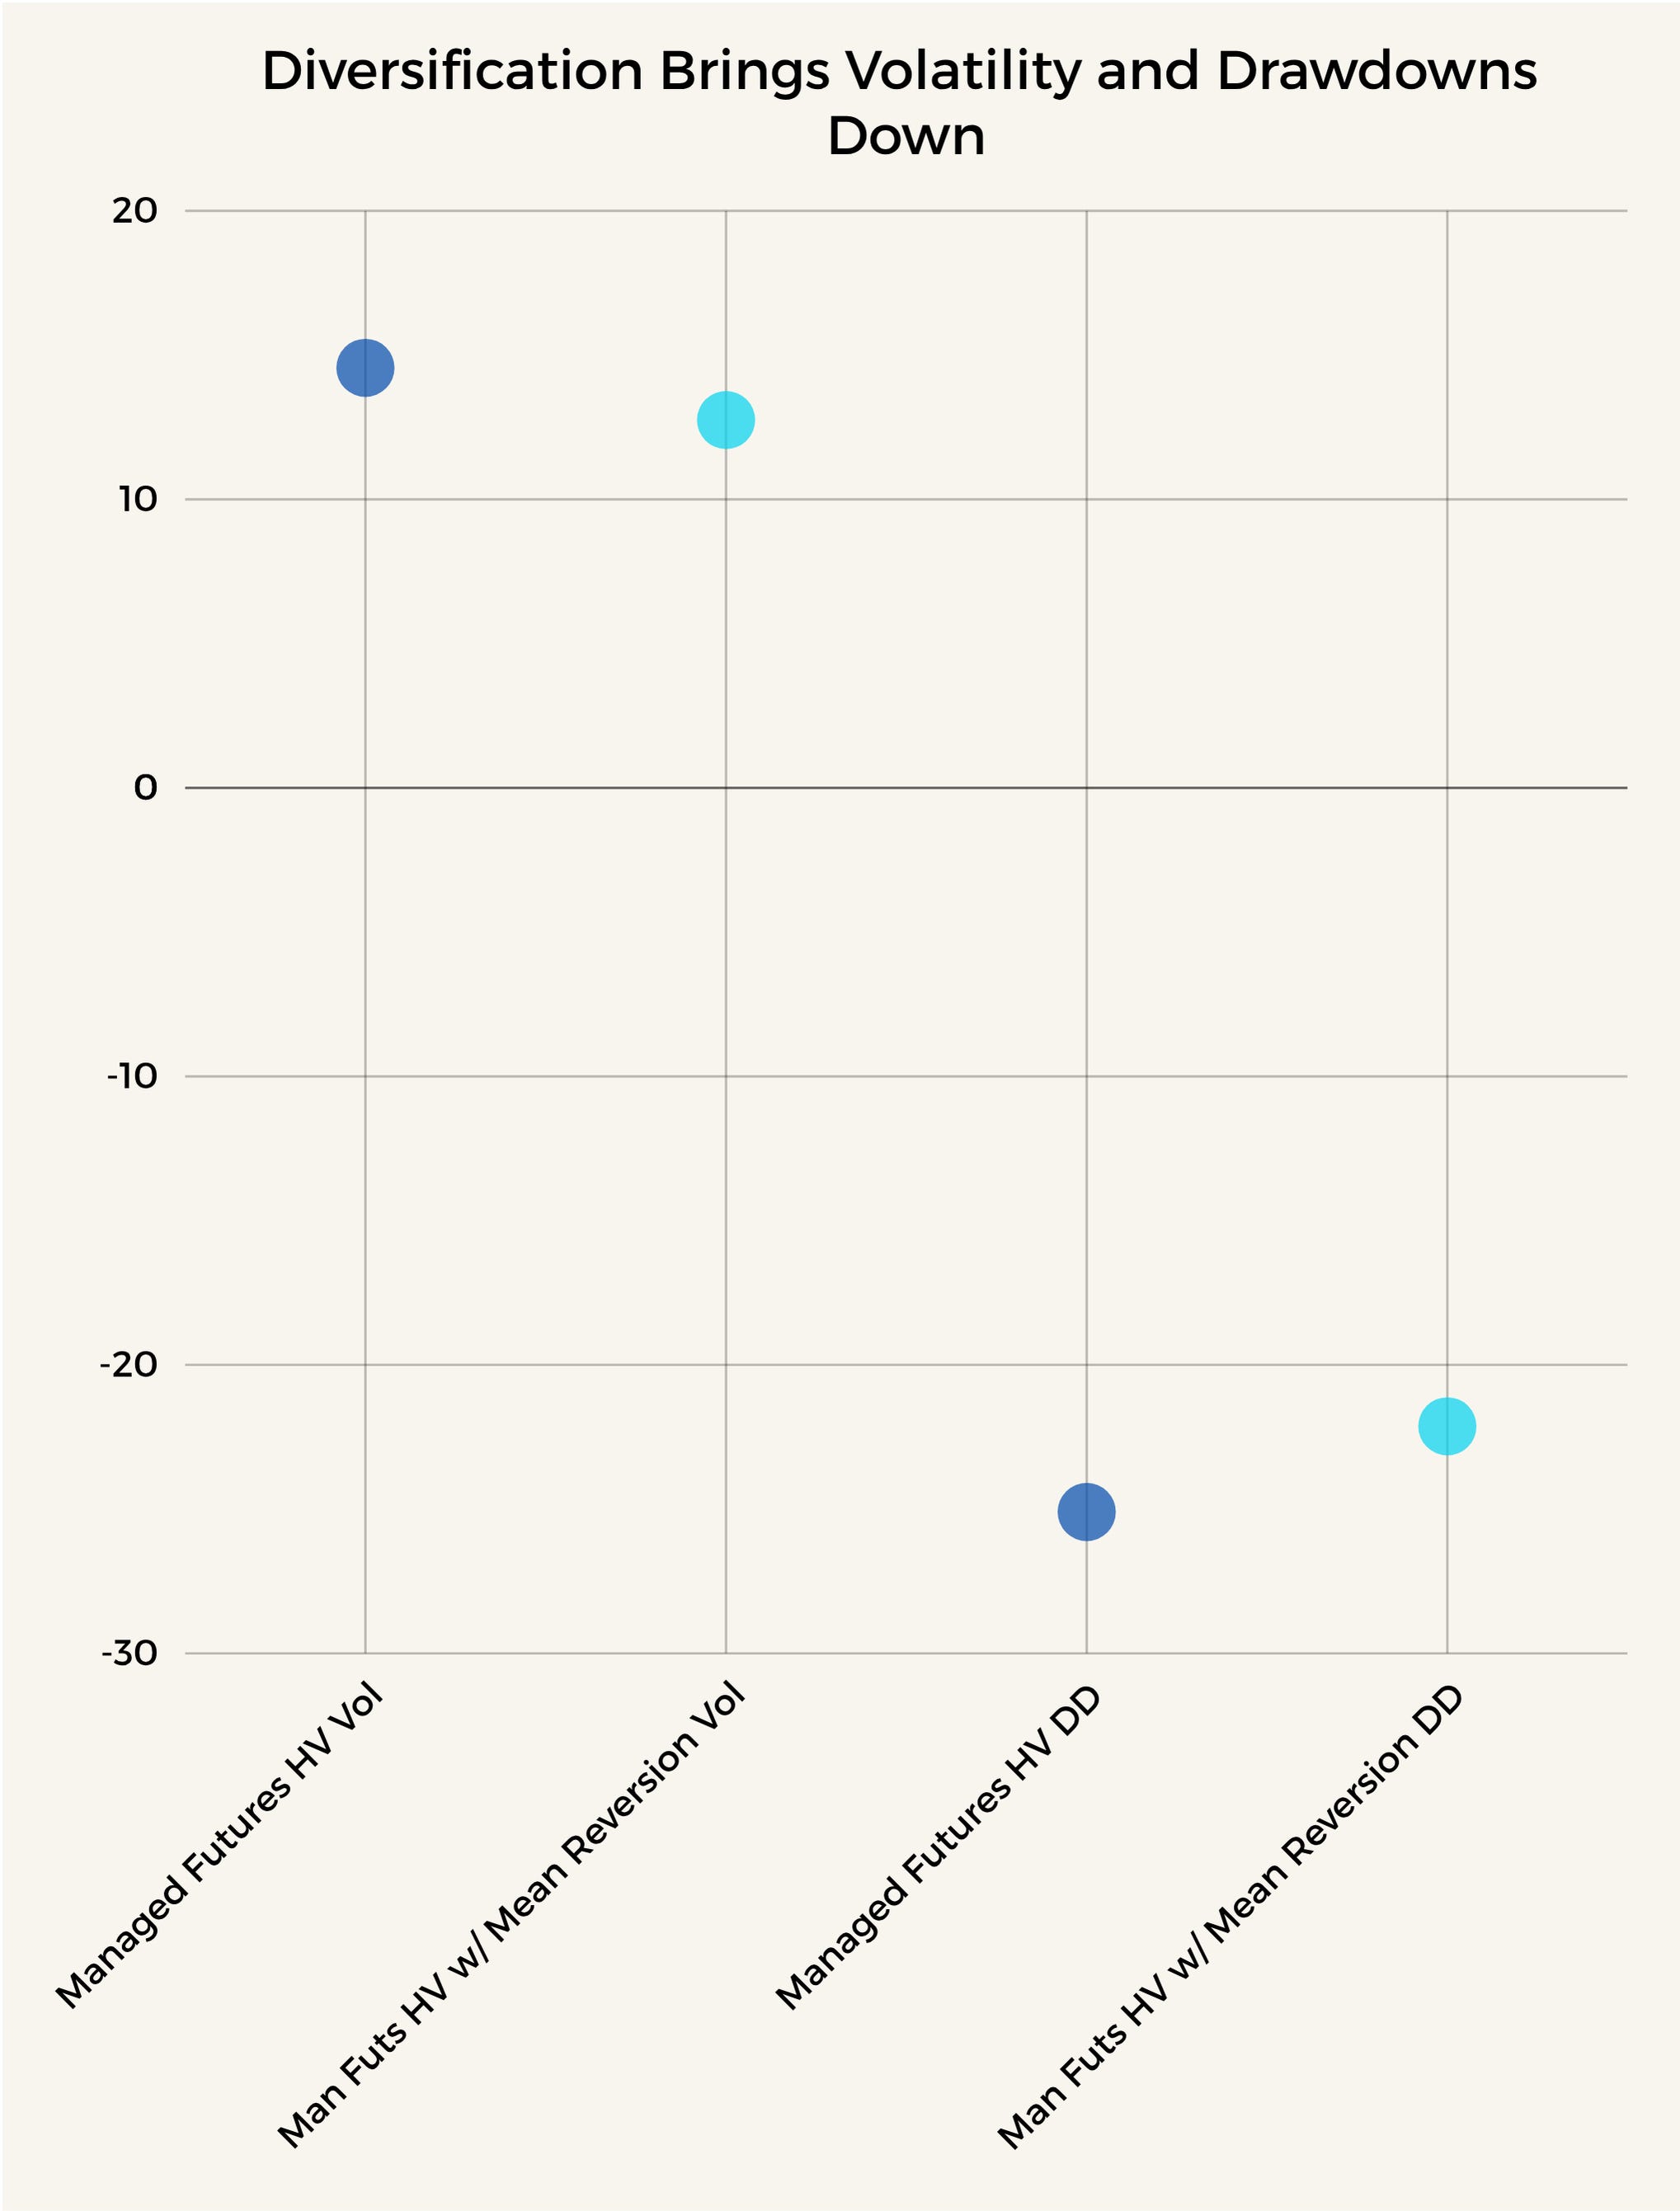
Lastly here, let’s take a look and make it quite obvious what real diversification is trying to achieve. I’m not talking about adding 5000 different names to a book and reducing company specific risk, that in general should be quite low. What we want is competing strategies, uncorrelated to each other that when added together we lower volatility, lower drawdowns, and deliver the same or higher returns. This is what we achieve below and also we can increase the properties as well by simply increasing the multipliers for the mean reversion strategy.
Note
I realize on review we talk about Man Futures EW and Man Futures HV and we tend to interchange these. Don’t get confused by that as it doesn’t matter much. Everything is the same and some display the properties a bit better than others. The dynamics, use, methodologies for Mean Reversion and results are the same, just sometimes more prominent and easier to show.
I can do a write up for Man Futures HV, as the strategy is more complex, but that’s another time.
Regarding the Individual Mean Reversion Strategy, I will do a separate write up of that shortly as this has gotten a bit long in the tooth.
Conclusion
Again these signals are all available on caltropia.com to view for free. You do have to sign up, that’s to try and stop ai crawlers. However, I do believe the signals as evidenced above should be easy to follow and if you have any questions leave them here or in the chat and we can discuss them further. I may add some equities to the Trend and Mean Reversion Dashboard, so again if you have specific equities you’d like let me know and I can add them.
Thanks for reading, I hope you find it somewhat useful.