
Demystifying Mean Reversion and Multi Strats, Part 2: Buy the Dip and Run Multi Strats Like a 🤴 or 👸
Buy the dip and reduce risk in your entire portfolio. Mean reversion isn’t just for a quick trade, it’s a strategy. Learn and create multi strats to now run your portfolio with real power

Before the Intro
Wait until you see what I have for you in Part 3. It may blow your mind a bit.
Intro
If you haven’t read Part 1, please give it a go, I think it should help explain some of the concepts discussed below and also will be a good way to get your feet wet in the Mean Reversion space.
Part 1 was more about how to use Mean Reversion within a Managed Futures Book as an overlay. Essentially, reducing or increasing existing positions with specific multipliers given our mean reversion signals. Therefore, we weren’t taking concentrated positions due to these signals. In this strategy the main objective is to take concentrated positions around these signals.
Due to this the strategy is run is rather different to the overlay system and you will see below the reasons for this. Of course again the main risks in anything like this is curve fitting etc. I can assure you there’s no curve fitting in any of the strategies or models. I want to make myself, you and my family money, cheating wouldn’t achieve that, plus Substack and my website don’t make anywhere near enough to waste my or your time.
Why Even Have a Mean Reversion Strategy?
This is a rather good question. Thanks for asking, I have fun writing these, so let me do some stupid jokes too. Yea, why bother? Markets just go up, every dip is bought, just hold and essentially there’s zero risk because in two months the market will be higher.
Not far off, that’s been the general dynamic. If you said that, you’d be right. Let’s be honest that’s done well and if you just keep throwing money at the dips you’ve made far more money than you know what to do with I’d hope.
The problem with this is we’re not investing for just the next year or two. We’re investing through market cycles and holding these investments throughout them. When we get older, things also change. We become more observant to losses or potential losses. We know we won’t sell, however, as we get closer to retirement reducing overall portfolio risk needs something different than just bonds or cash.
Furthermore, even if you’re younger these approaches still make sense. If you have a market drawdown of -32% and your overall book only has a drawdown of -20% and you’re smart and buy the dip, you’re going to do far better than if you were just invested in the market index. Far far better.
So yes, minimizing drawdowns as you get closer to retirement is important, and it also makes you a buy the dip king/queen. It makes your wife/husband or gf/bf happier. I know mine would be 😂 She doesn’t read this stuff, good thing too cause that might get a slap.
Results First
Let’s do the results first, that way you can see them and if they don’t impress you can just read something else and save your time.
The first chart I’ll show you is 1. Mean Reversion Strategy Alone and 2. If you just bought SPY (S&P 500 ETF). Chart 2 will be the individual metrics of both. Based on weekly data.
Chart 1
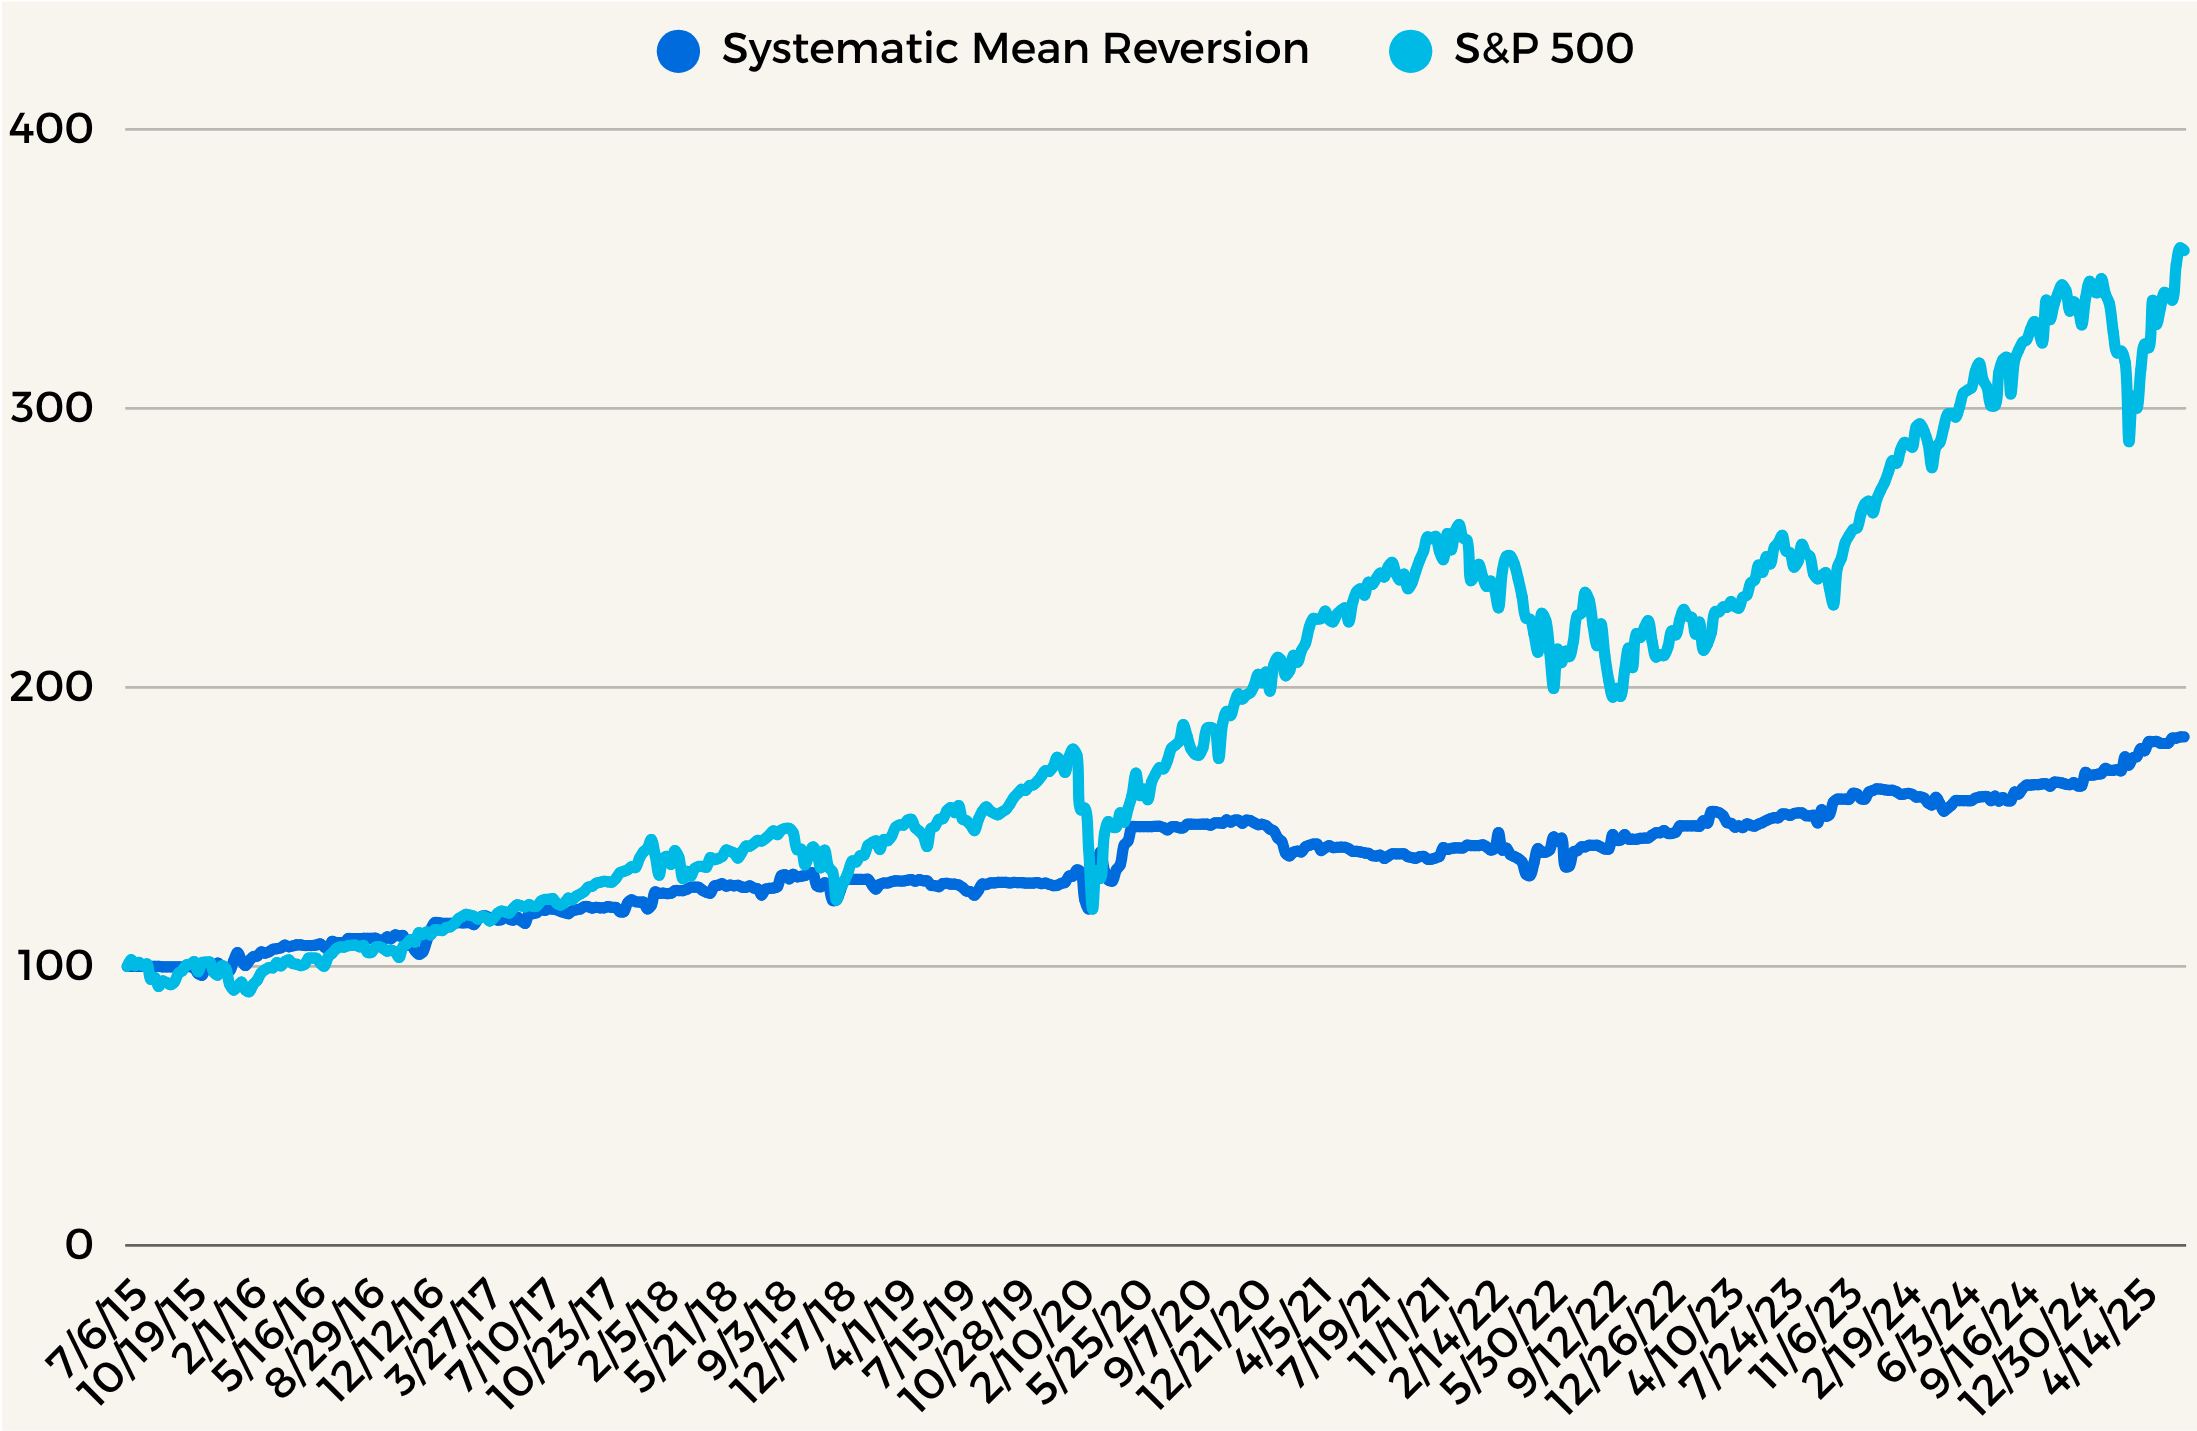
You can draw your own impressions on the above. I would like to point you to some specific points in time, like 2018, 2019, 2020 Covid, the entire year of 2022, and also our most recent tariff drawdown.
Why these times specifically? Well 2018, market ended that year pretty rough, and mean reversion held it together keeping you positive for that year, allowing a great buy the dip while your portfolio was up, compared to market which was down.
2019 I want to focus on because, Mean Reversion did nothing that year. It was basically flat. It did hold up during the May 2019 dd, which again would have allowed you an even better dip buy opportunity, however, for the year there wasn’t much positioning taken on that year.
2020, Mean Reversion was up for Feb and March, again allowing you an even better buy the dip.
2022, we all remember that frustrating year, market going down but every dip being bought only to slightly bleed some more and then have that dip bought too. That was fun. Great mean reversion environment though. Mean Reversion was up that year, compared to the market being down. Again giving you, yep you guessed it, another better buy the dip the opportunity.
Finally 2025, tariff fun. Remember him holding the board up as we watched the market completely fall apart, great times. Good mean reverting environment however. You guessed it, up in Feb and up in March. Giving you what? Yep another great buy the dip for your overall book opportunity. Are you sick of buy the dip yet? I know I am.
We can easily see the dynamics and benefits to introducing this system into your overall investment strategy above and what it means introducing it. I think it’s pretty cool, I hope you think it is too. The best part is it’s not very complex or complicated to implement at all and there are various ways to implement it in different ways if you desire.
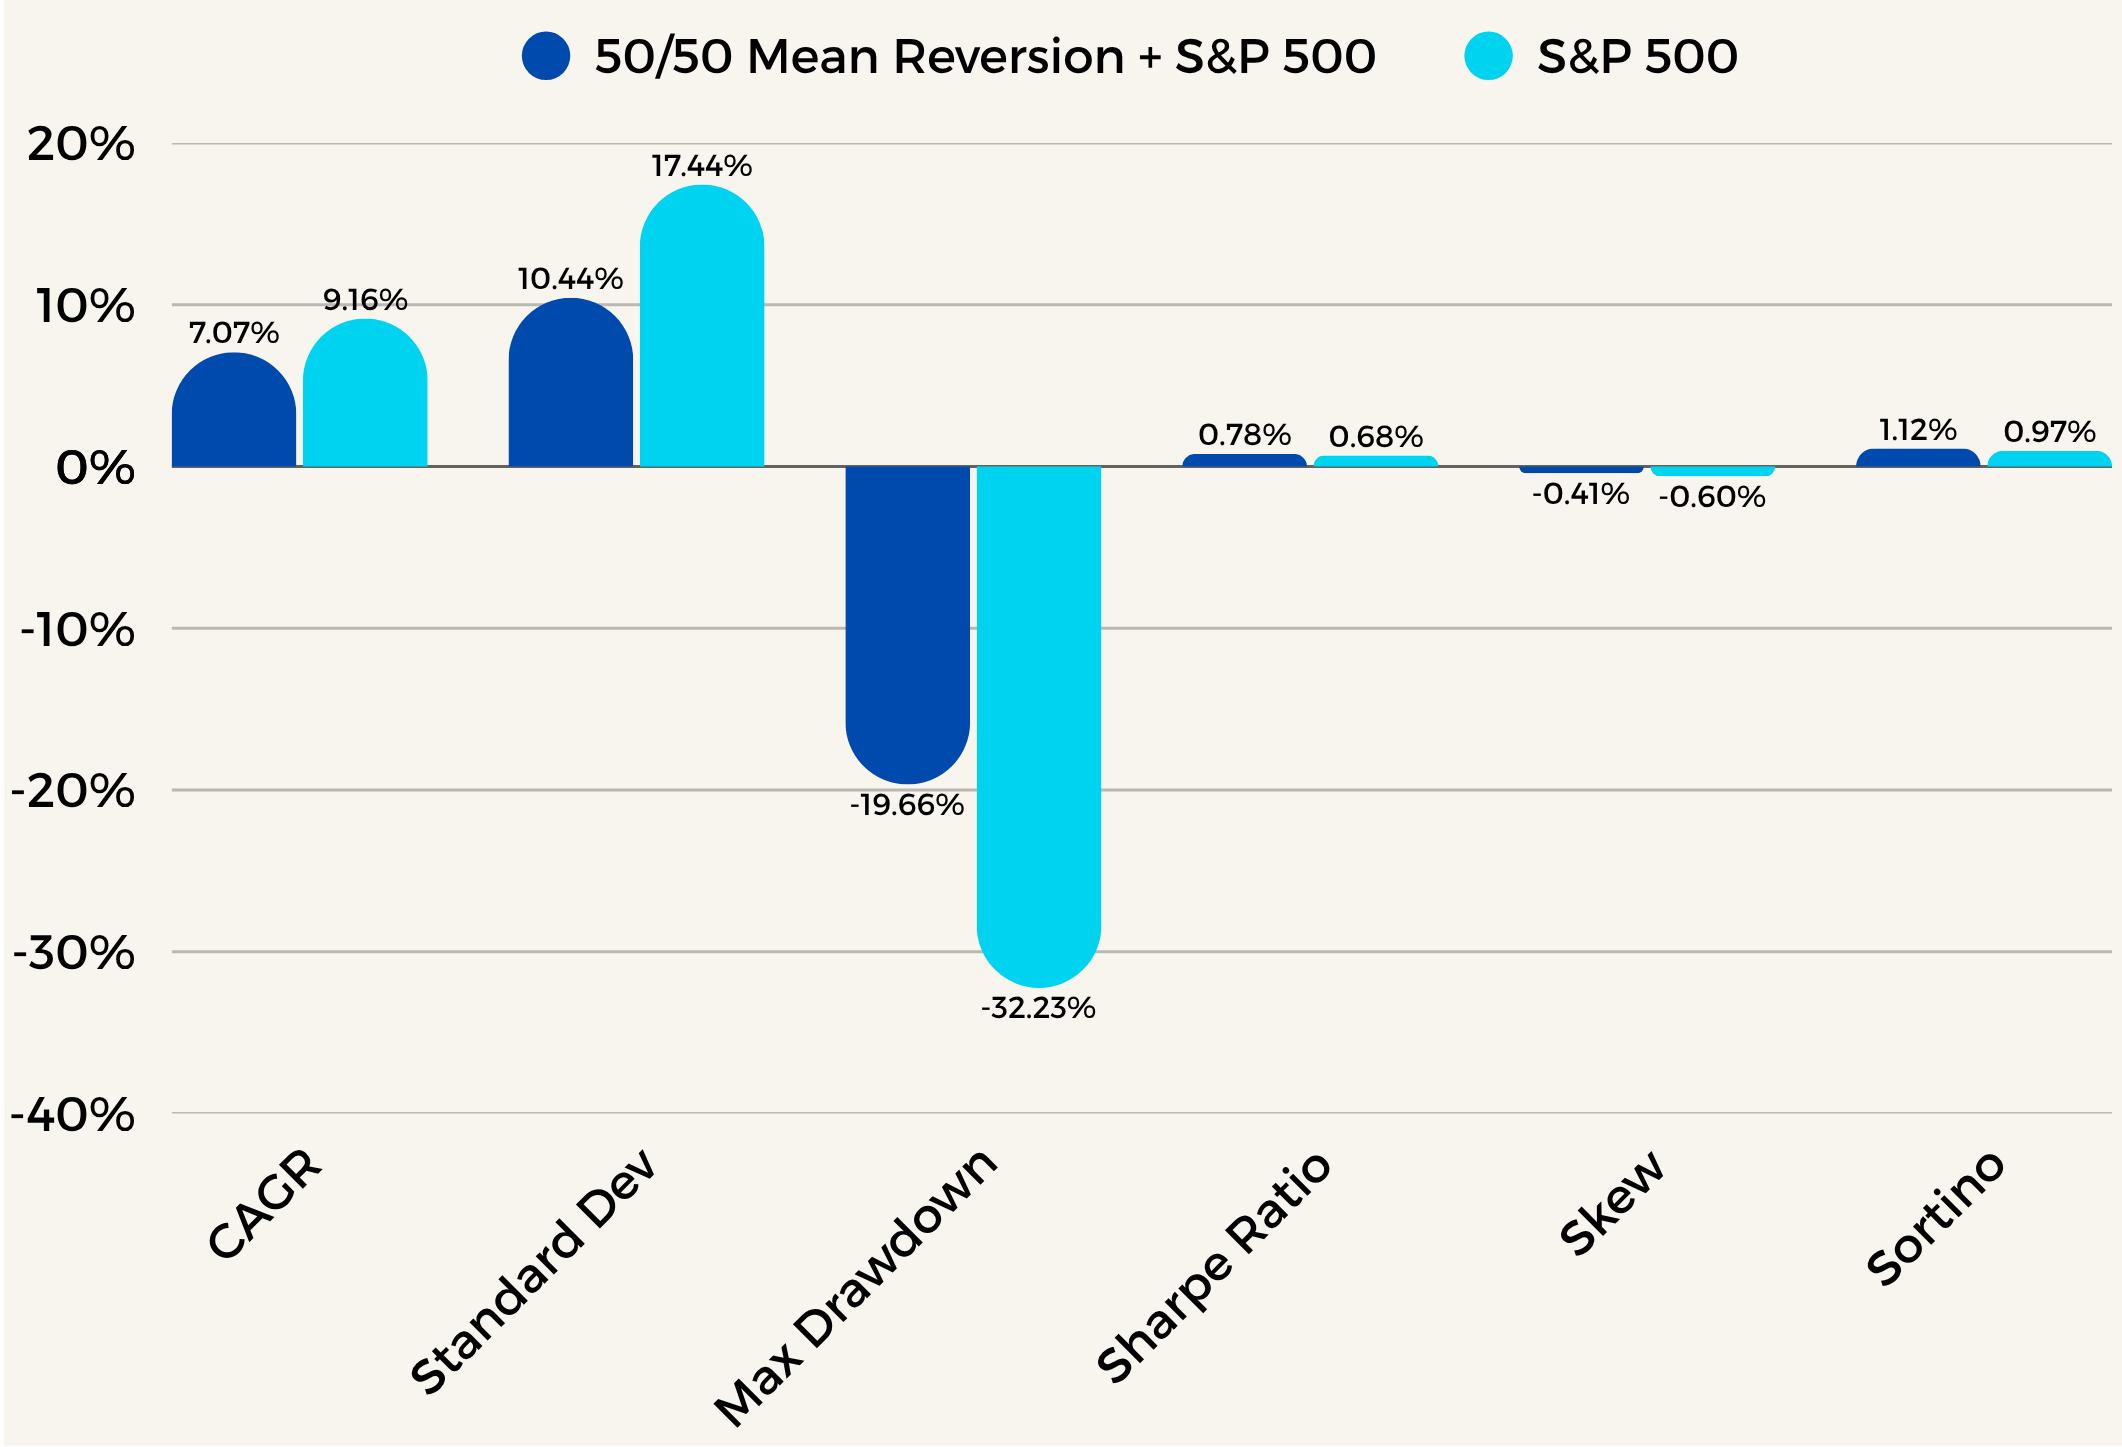
Chart 2
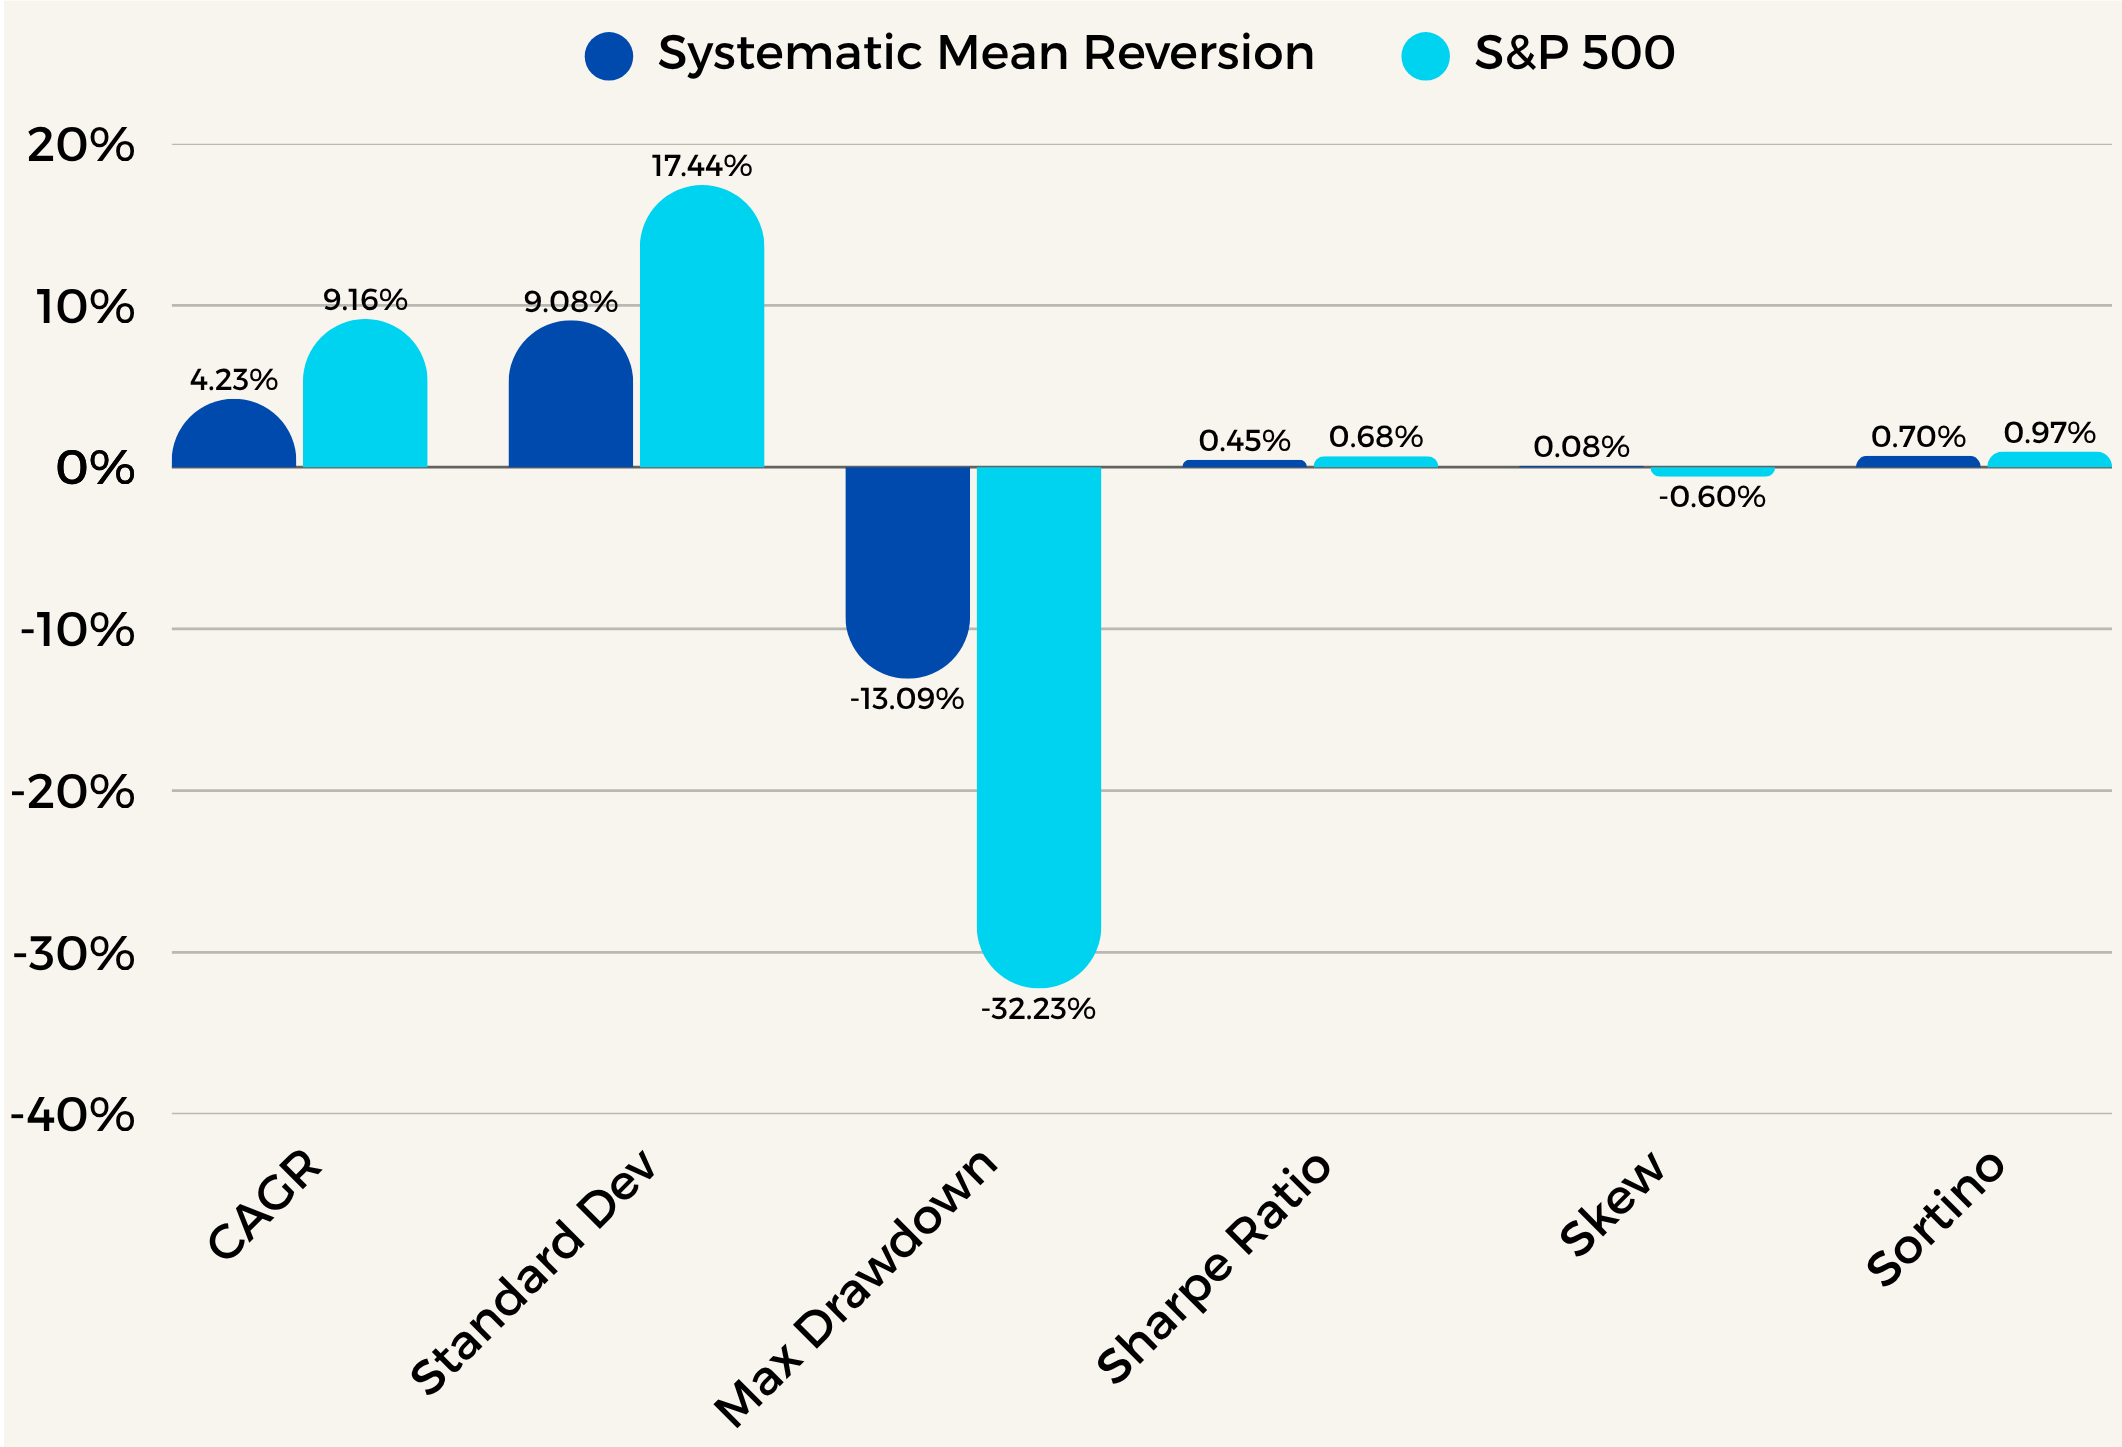
We can take a look at some key performance metrics next. Skew, relatively low, but still positive compared to the S&P 500. We can also infer and understand why this strategy reduced the skew in the Managed Futures Strategy with Mean Reversion Overlay. Drawdown is quite good and low, and other metrics look fine as well. Try and think what adding this strategy to just an S&P 500 allocation would do for these metrics and keep that in mind for now. In the next chart I’d like to look at correlations overtime between Mean Reversion and the S&P 500.
Chart 3
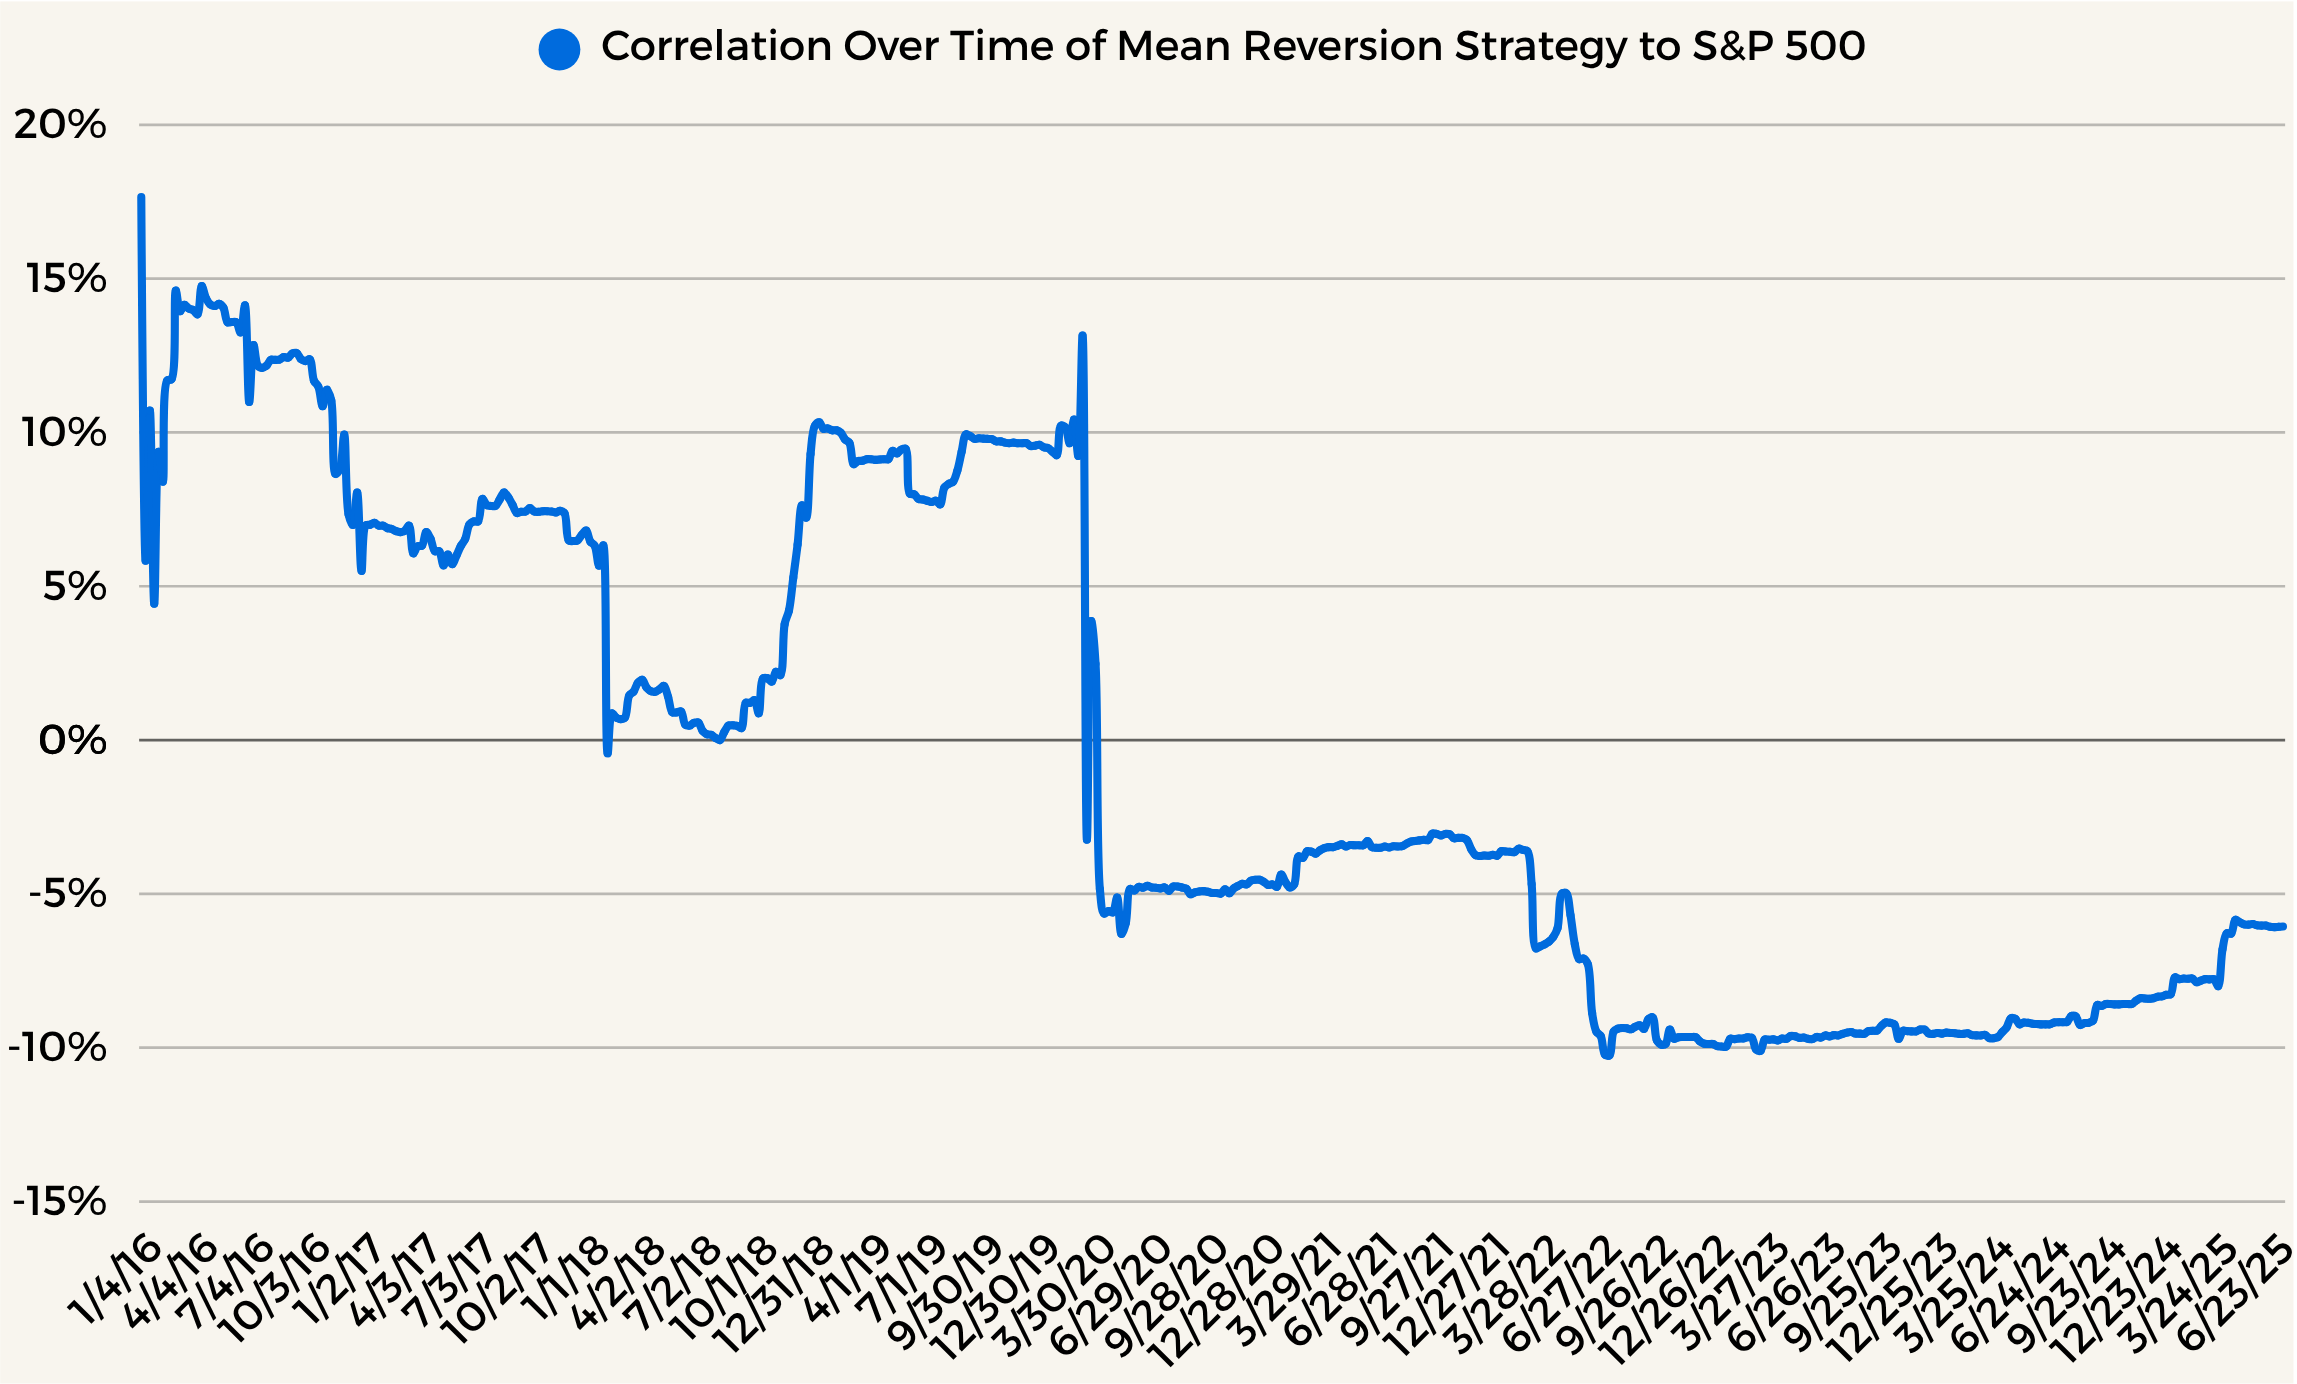
Above we have our correlations of the Mean Reversion Strategy to the S&P 500. This is exactly what we’d like to see when considering weather we should add this to another Strategy or Portfolio. We can see correlations are generally very low, and for the most part when we need them during times of market stress, they become even lower. A lot of the time during market stress correlations between strategies tend to converge towards 1. However, we can see here that for the most part during these times of market stress, correlations tend to sharply drop off, opposed to steeply inclining to 1. This is very powerful and you’ll see why when we add a 50% allocation of Mean Reversion to a 50% allocation of SPY.
Let’s observe Chart 4, which is that 50/50 Strategy.
Chart 4
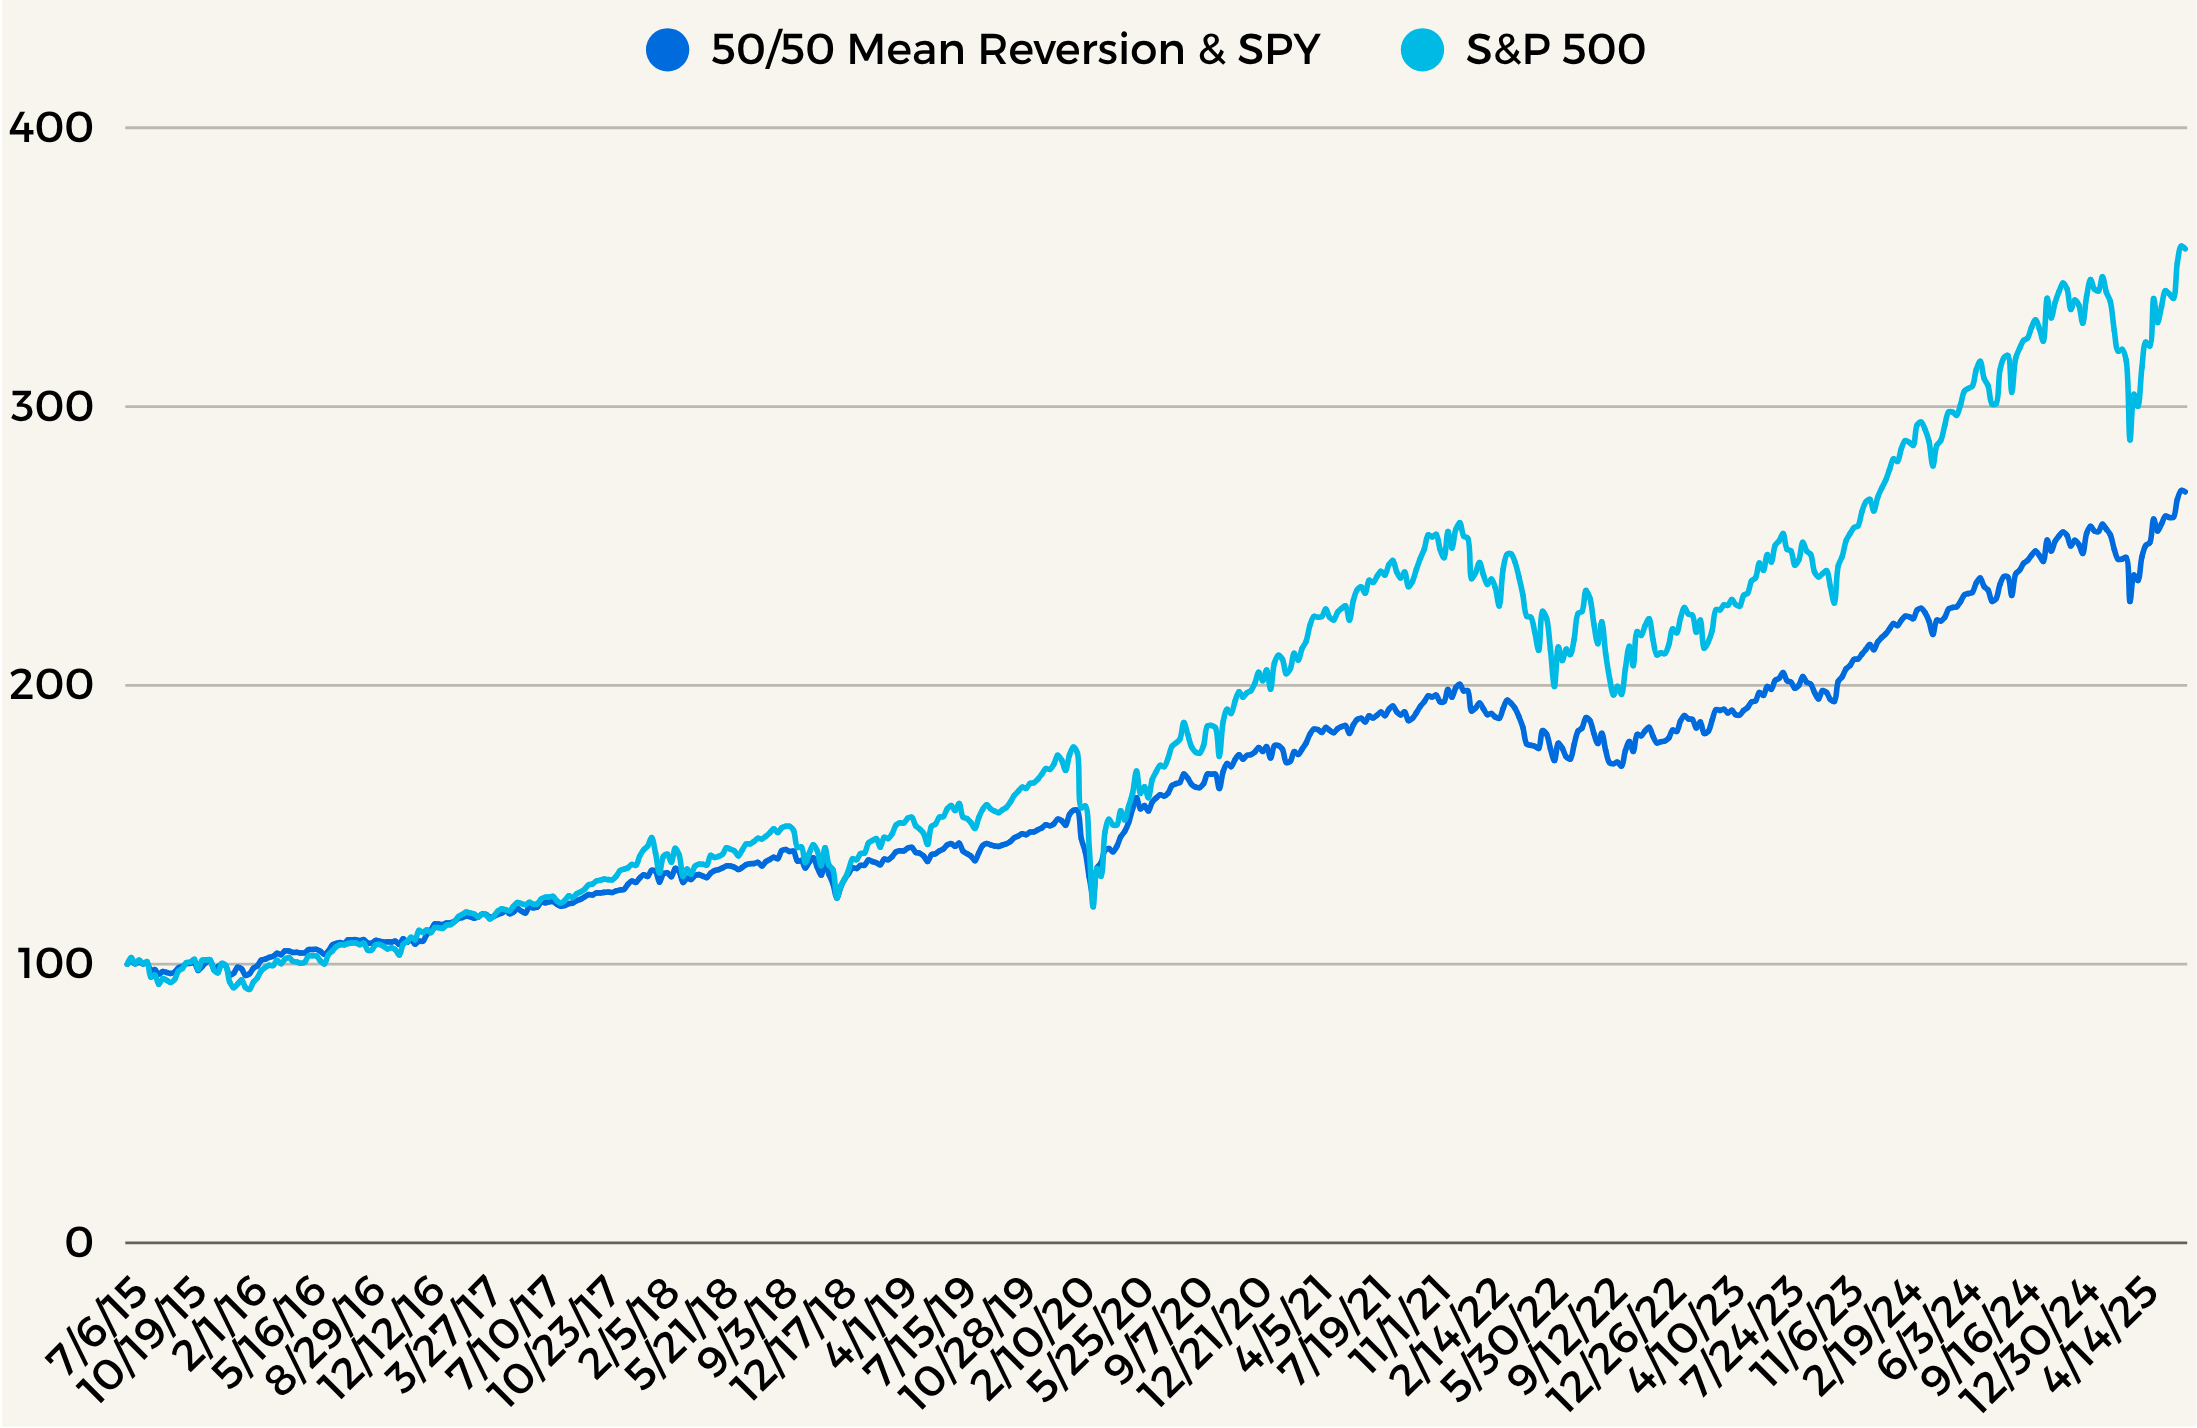
Look at this return series of 50/50 Mean Reversion and SPY. Look at the prior points in time I mentioned before to see the benefits around those time periods. So you don’t have to scroll up. 2018, 2019, 2020, 2022, and 2025 are those points. You can see lower dd’s around all those time periods. The negative correlations between the two had a drastic impact on reducing your overall volatility, but most importantly your drawdowns. We can also see the underperformance around the 2019’s as well. It’s not always sunshine and roses in systematic strategy world. However, with these powerful strategies there are portfolio implementations we may consider. I will speak about those later.
Chart 5 is the key metrics between a 50/50 Mean Reversion + SPY Strategy compared with just an SPY Strategy.
Chart 5
We can see for the volatility of the overall book, the CAGR is quite good. Vol is lower, DD lower, Sharpe Higher, Skew and Sortino, slightly changed as well. This is exactly what I’d like to see when combining two uncorrelated books. We want to see vol, and dd decrease. While we also see CAGR and Sharpe increase. This means we will combine these books and continue logically expanding our investment strategy without curve fitting or any of the other pitfalls that occur.
What’s next you might ask? How could this evolve from here? Remember Part 1. We also have our EW Managed Futures Book. Let’s add that. Why?
Because Mean Reversion is uncorrelated with EW Man Futs and SPY.
EW Man Futs is uncorrelated with Mean Reversion and SPY as well.
This is a perfect strategy to add to an already well rounded and diversified, powerful book.
Let’s examine the results of doing so in Chart 6.
Chart 6
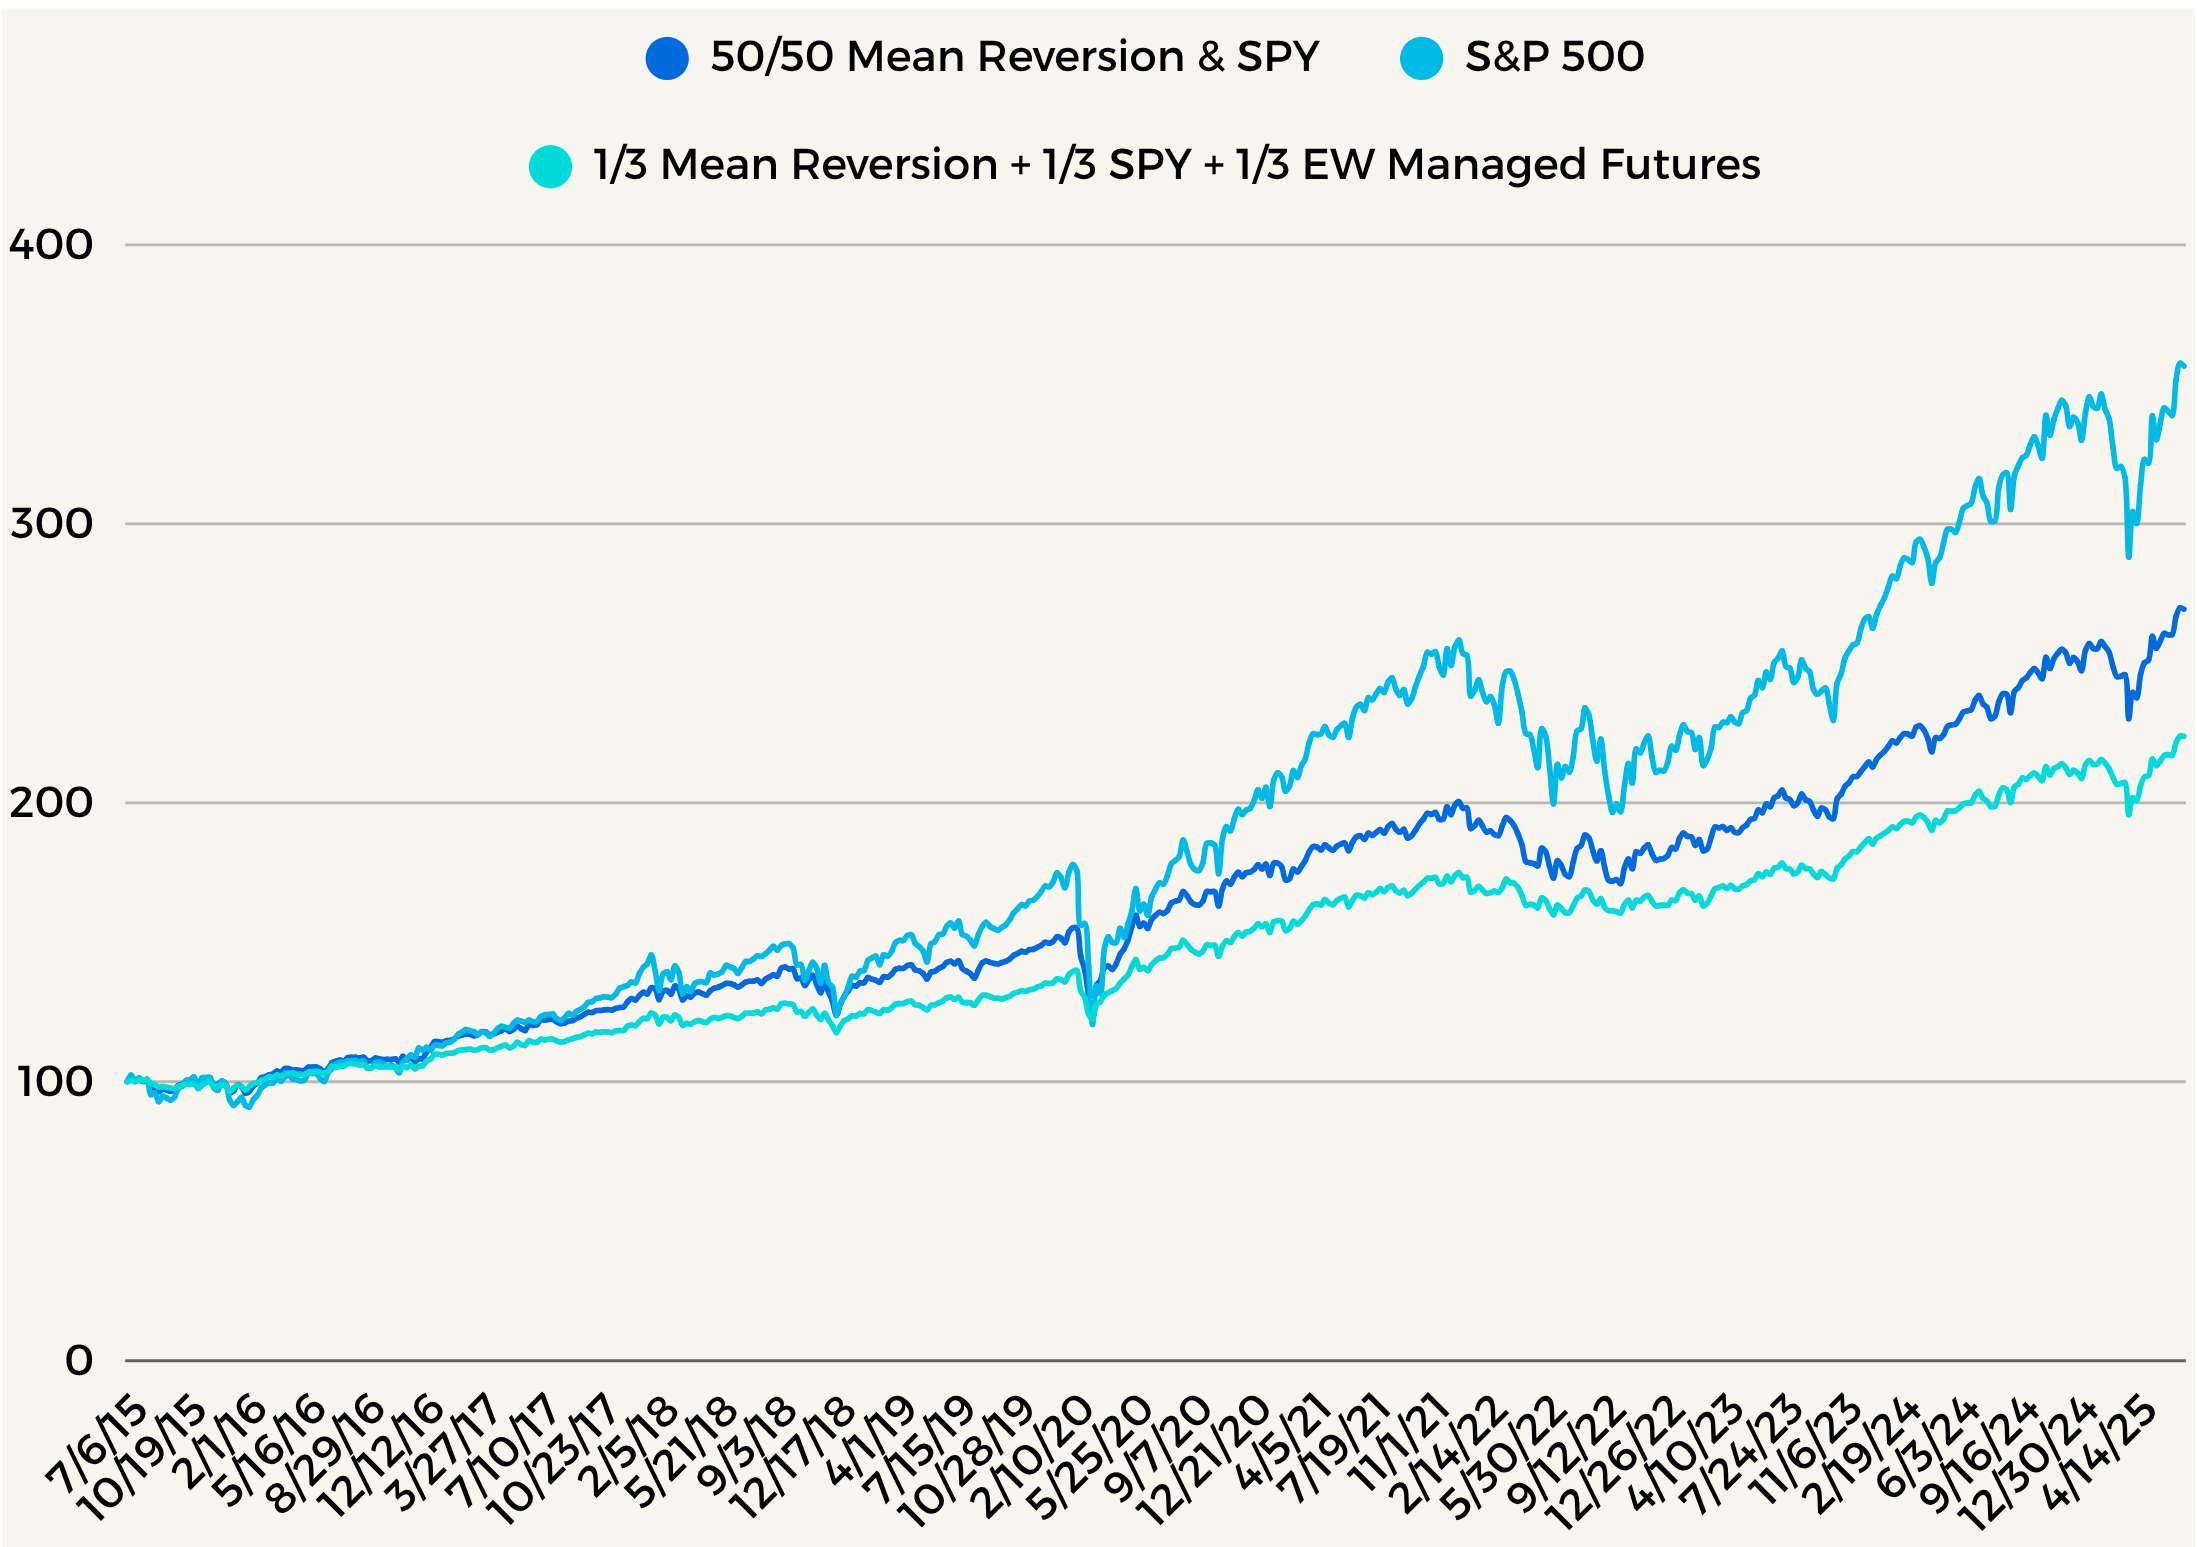
Quick, what do you notice? It doesn’t matter, you can’t be wrong, this is for fun and learning anyway.
Decrease in Vol is evident
Decrease in Return is apparent
Drawdowns are reduced
It’s more stable right?
All the above would be fair assumptions just tasking a quick look and going with your first instincts.
Why would this happen? Adding another uncorrelated strategy with low vol, low dd’s and more. Also decreasing SPY from 50% to 33% to make room for the EW Man Futs Strategy also will have an impact as well.
I know you’re thinking, NO! I don’t want this, I want to make more money!! Not reduce my returns with albeit lower vol and dd. We’ll fix this in another logical, fair, and easily implemented way soon.
Let’s examine Chart 7. Think about what we can do here, with this existing book. What would we do when vol is quite clearly so low?
Chart 7
If you guessed leverage, then yes! You’re right! I know leverage is the devil. Wrong the devil is already hidden on Twitter and Substack manipulating you into destruction. There’s good ppl there too, like Vol Vibes here for instance.
Let’s use leverage, and we’ll use ES or MES Futures to do so. This keeps our capital free and is a more efficient way to lever up our book. Let’s see what happens in Chart 8 when we do so.
Chart 8
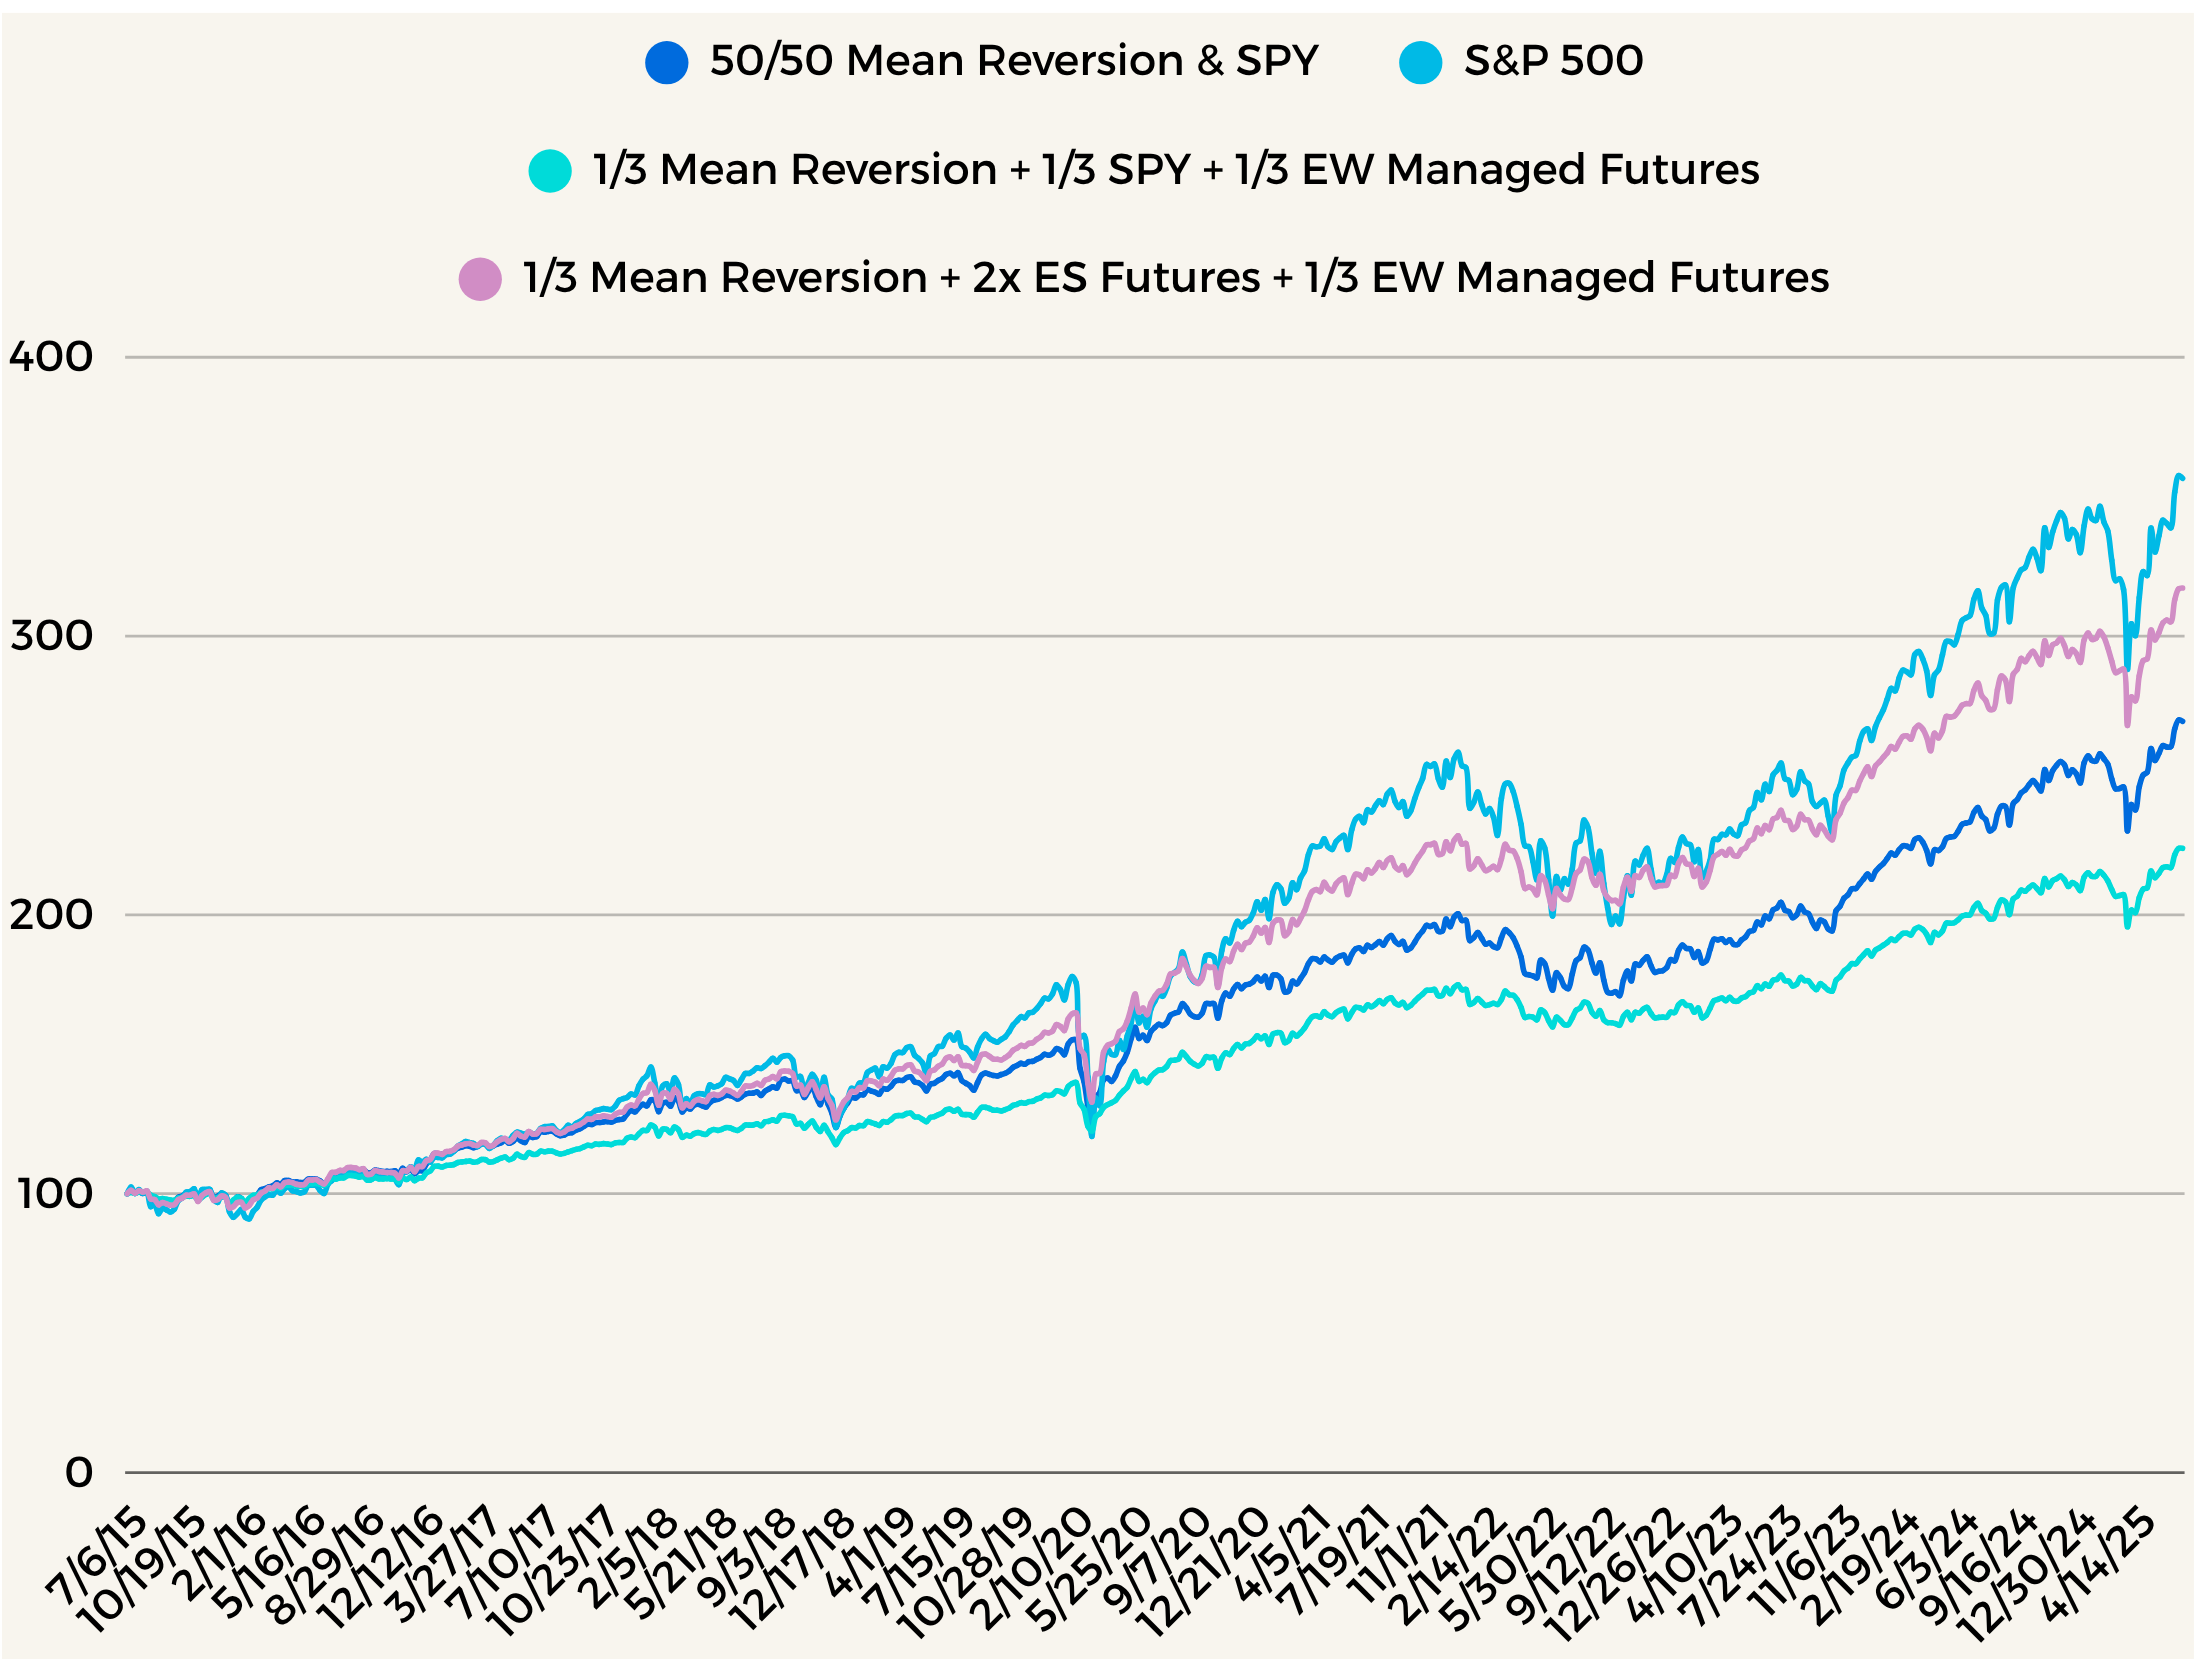
Great! Look at the big jump from Equal weight 1/3 above. This doesn’t mean much though until we go through our metrics and compare. However, this is of course what we’d like to see prior to going into that.
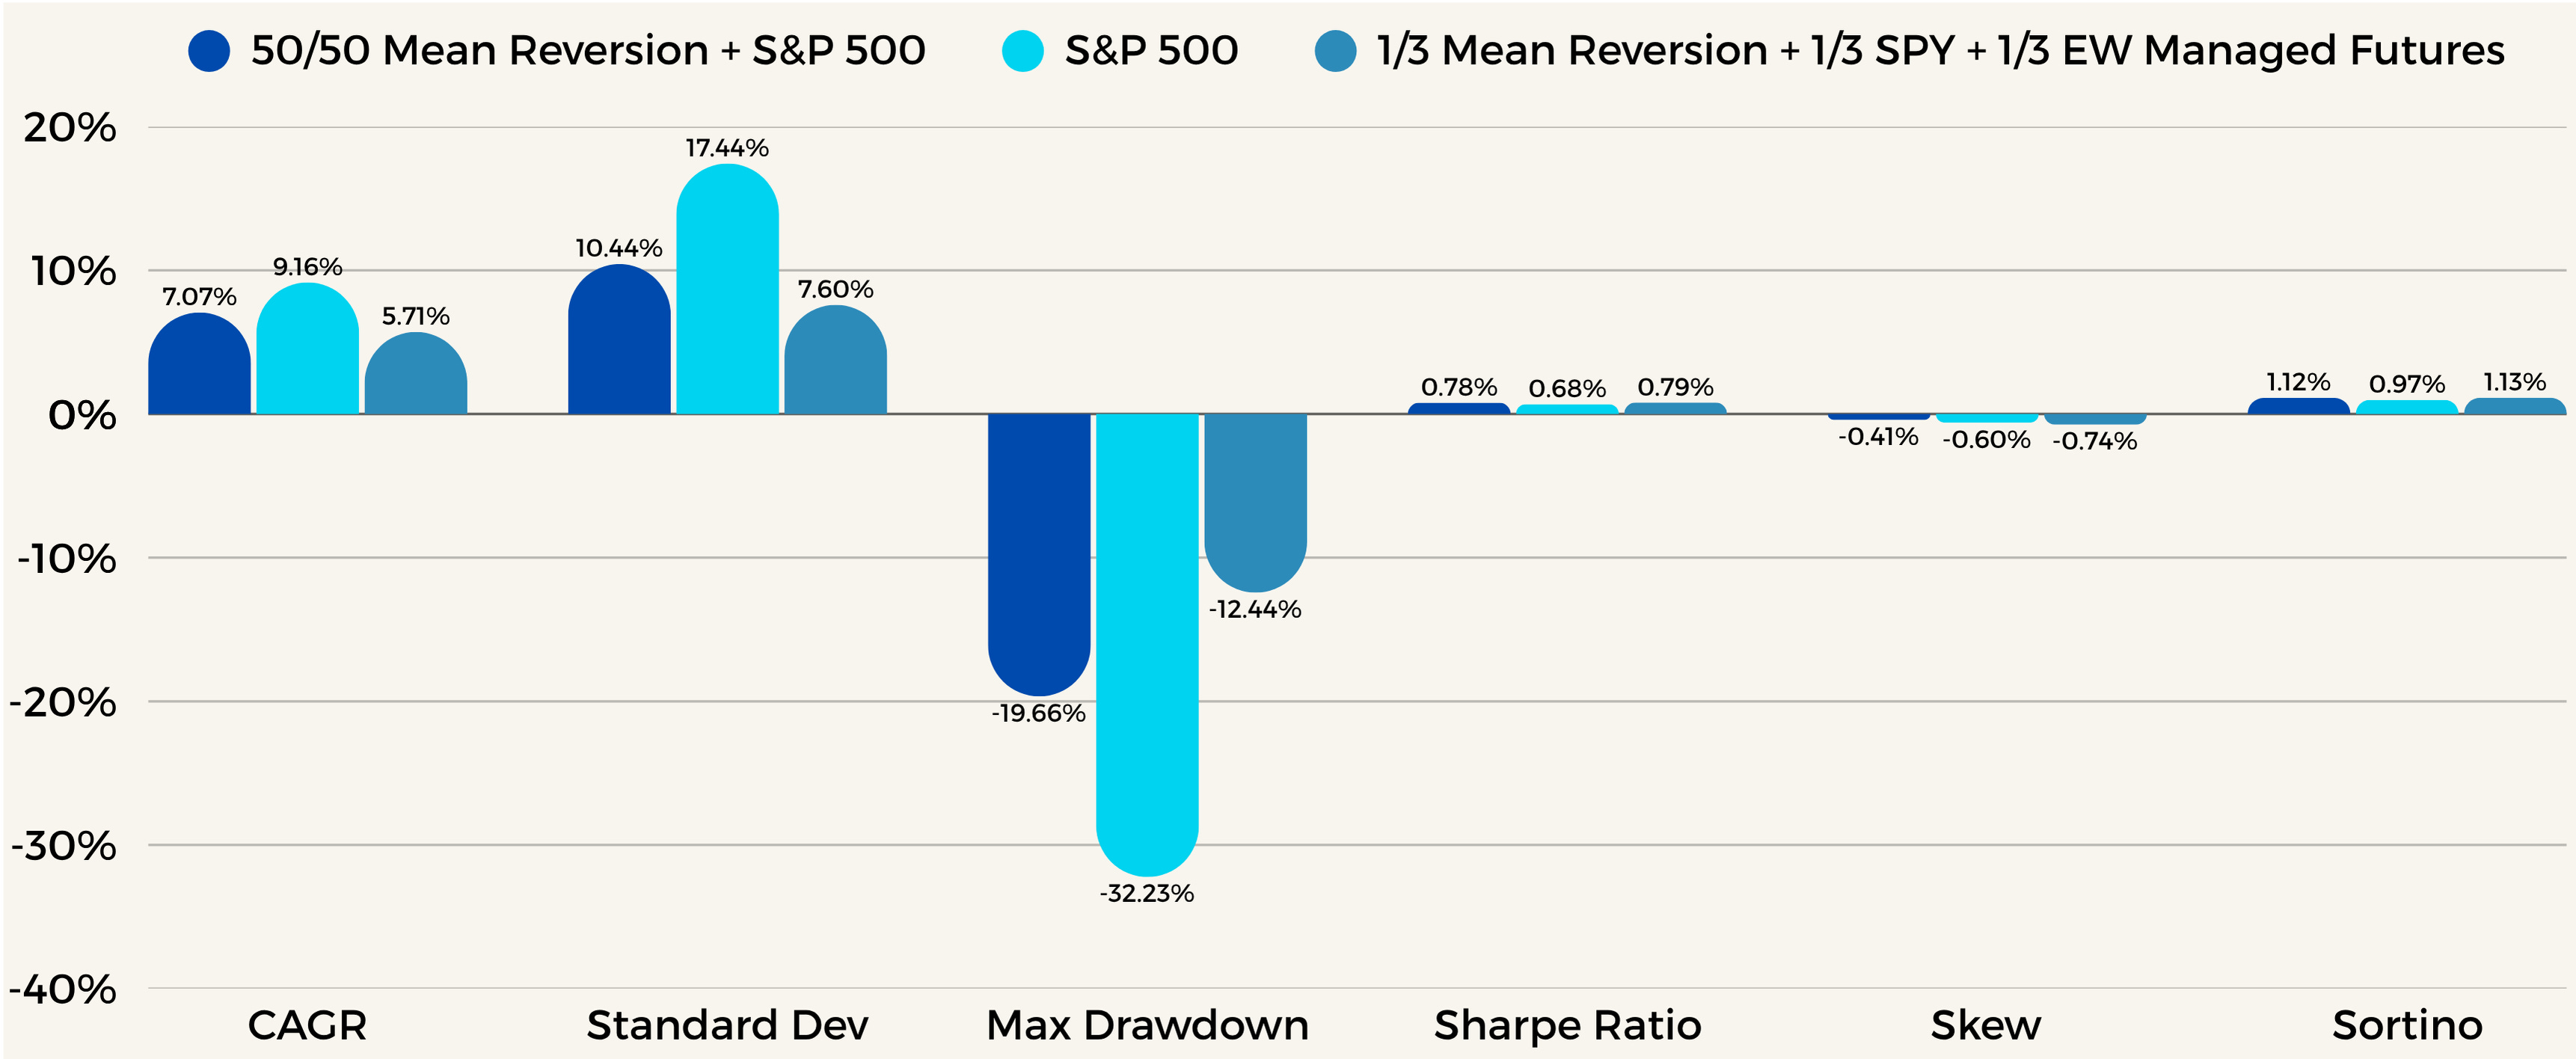
Chart 9
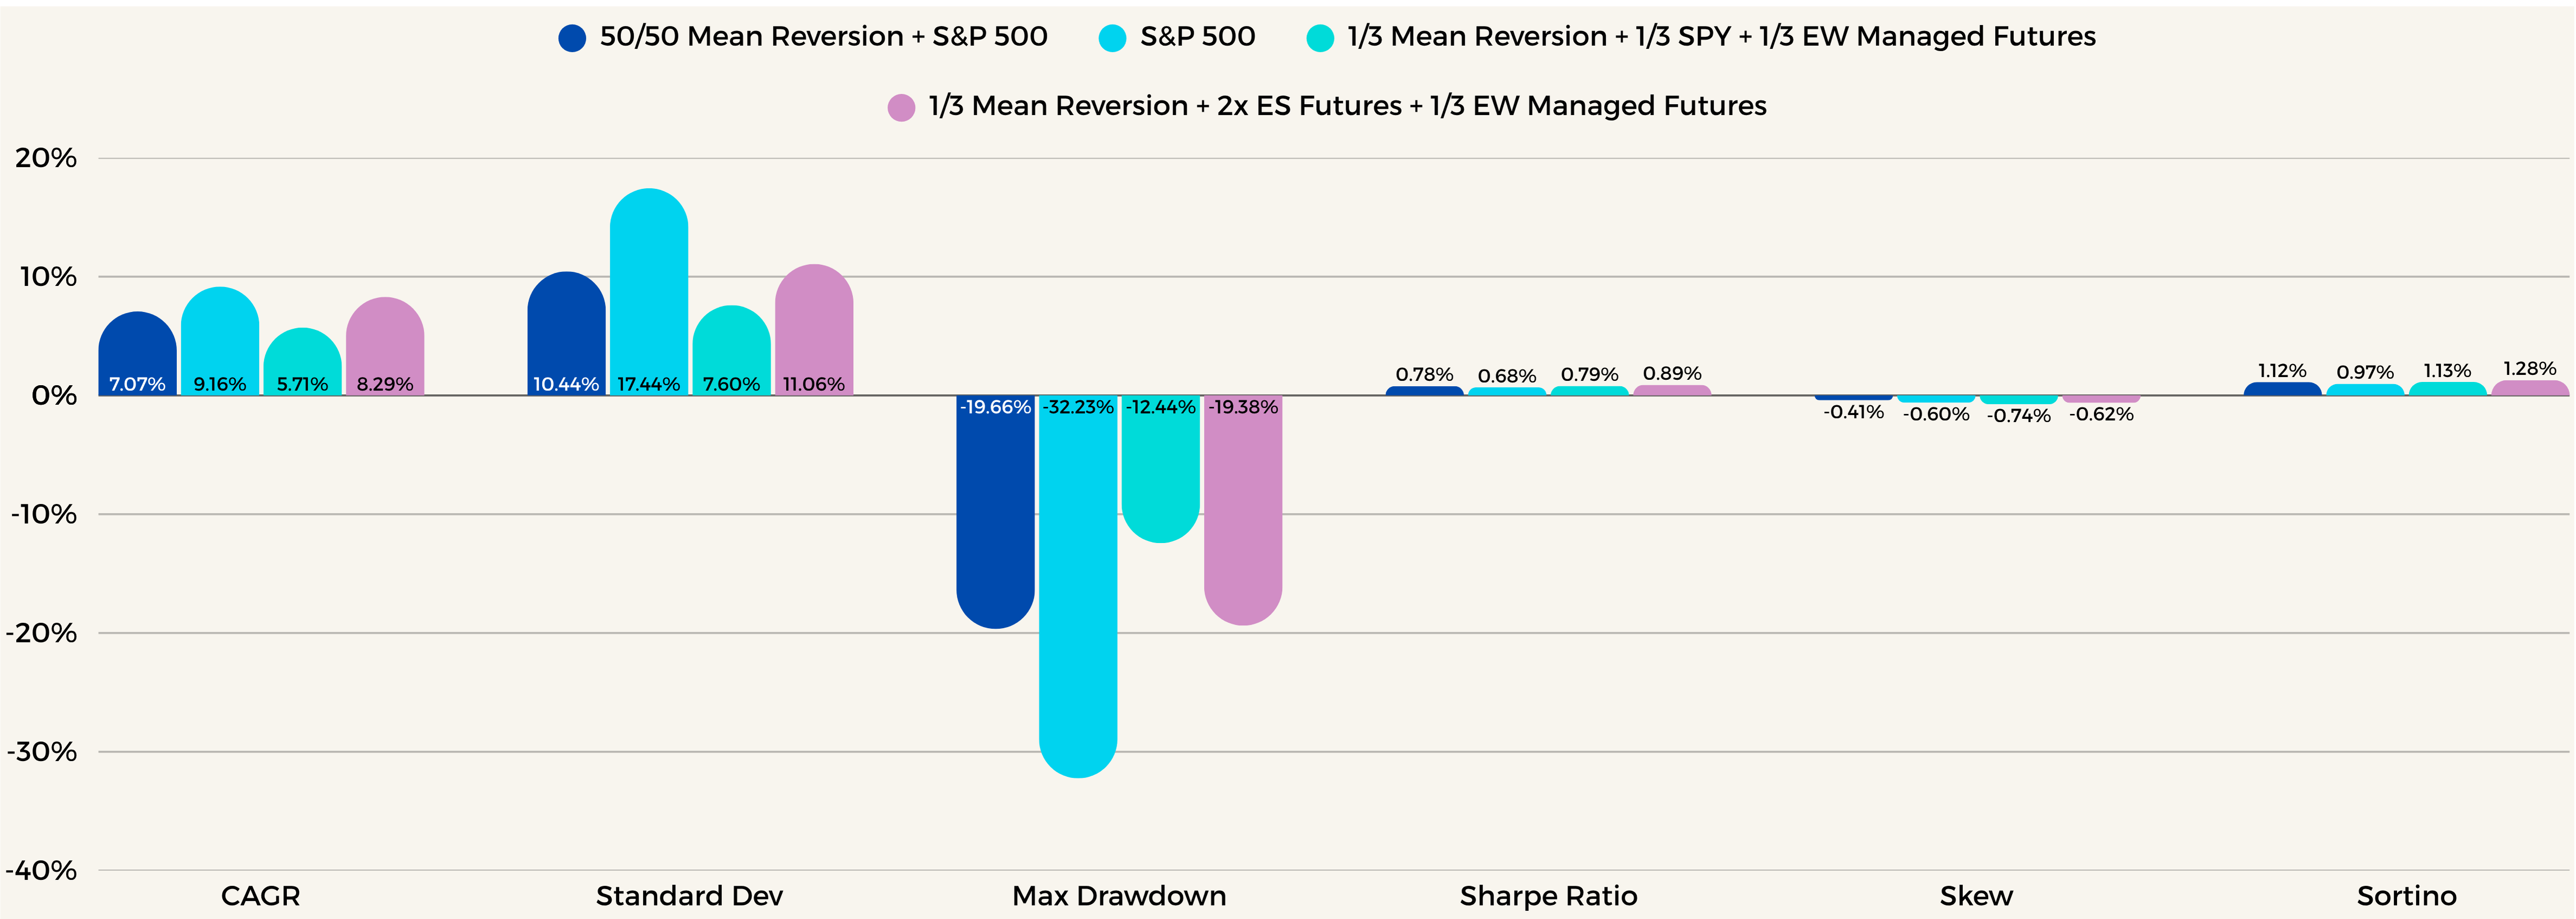
Now we’re cooking. Higher CAGR than 50/50 and 1/3 EW. A little higher on Vol than 50/50 and of course 1/3 EW. DD is great compared to 50/50. Sharpe is highest of all of them. Most important however, vol is still lower than just the S&P 500 alone, DD is still lower, Sharpe higher. Everything is exactly as you’d hope when starting to bring uncorrelated investment strategies together. By having such a book to begin with we can utilize leverage to increase our risk dynamically so we can have access to higher returns while also keeping overall vol and dd low. This is very powerful and should change the way you start thinking about investing. Best part of all, it’s really not that difficult to implement all of this.
Prior to us discussing implementation, I’d like you all to take a look at the Mean Reversion Scores from the Market Stress time periods we discussed above.
Chart 10 - 2018
Chart 11 - 2020 Covid
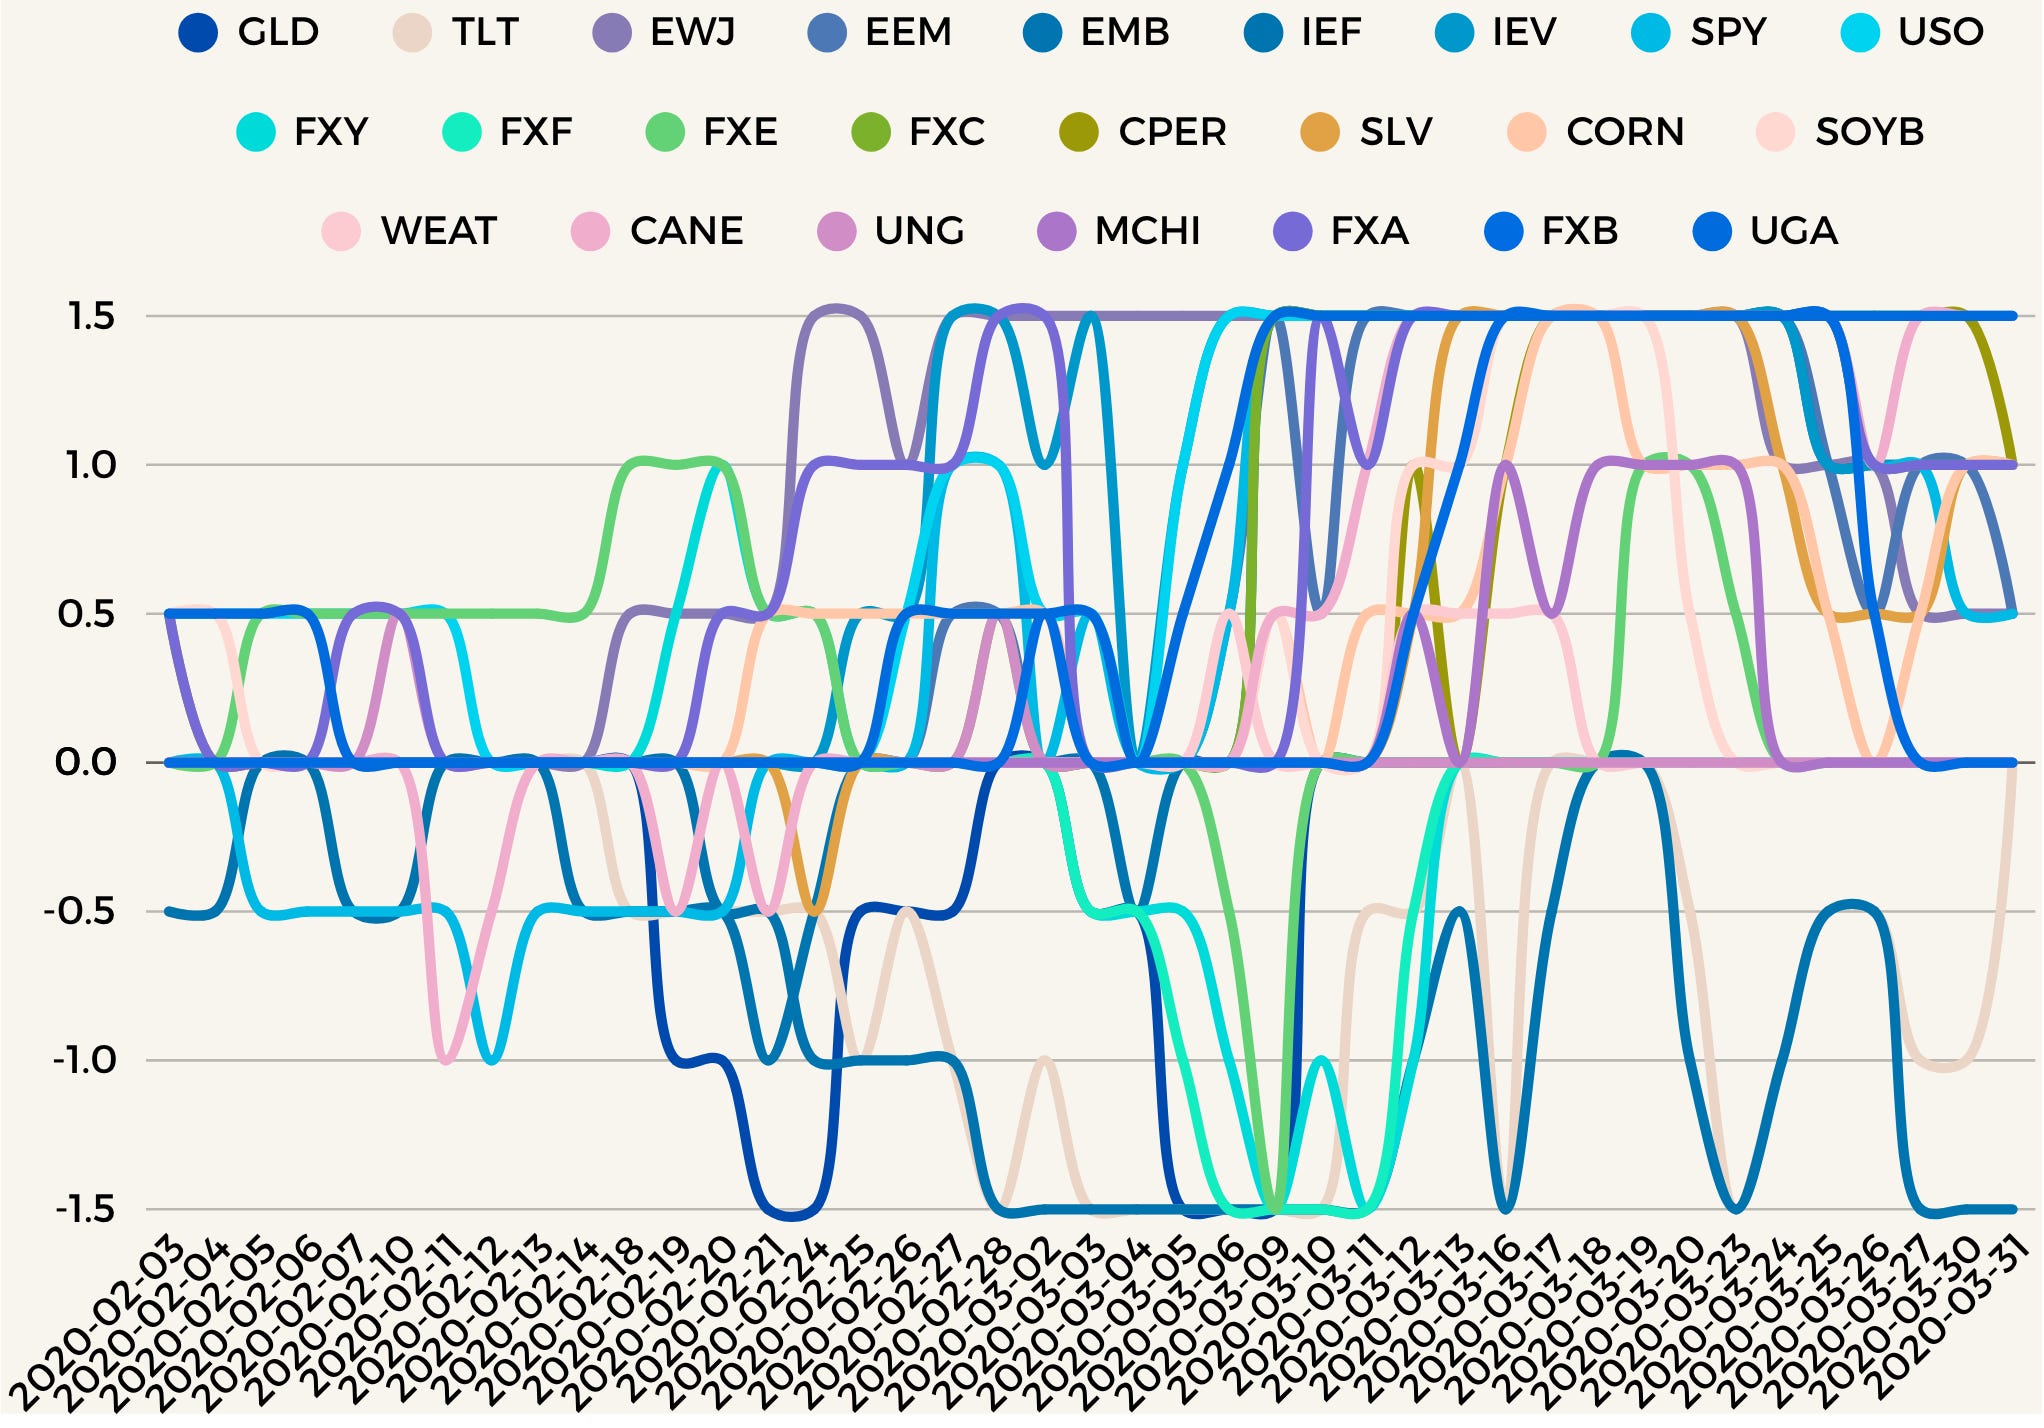
Chart 12 2022 - Inflation + Interest Rate Fun
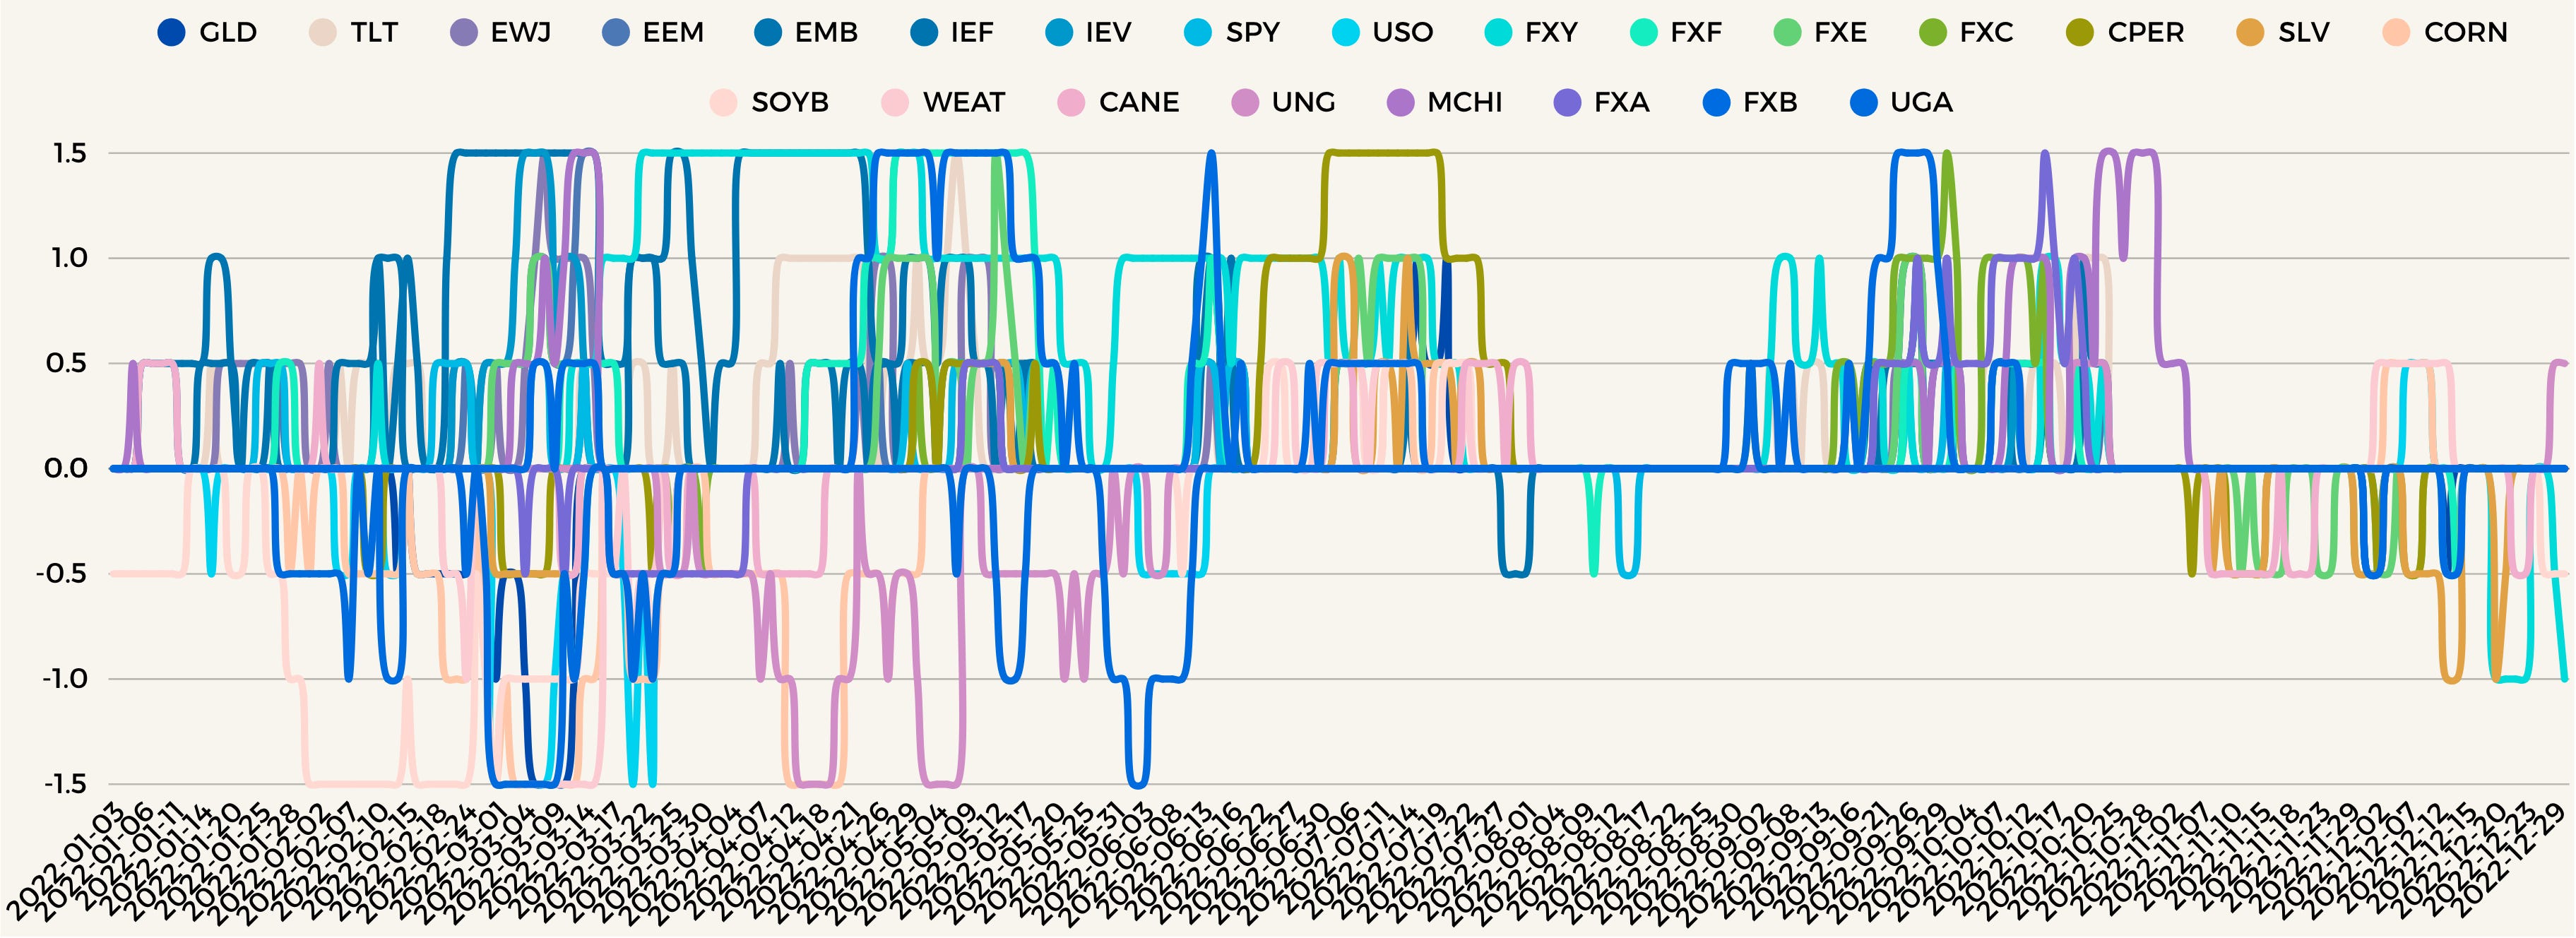
Chart 13 2025 - Tariff Tacos (Those were some good Mean Reversion Bits in there too)
Implementation
Depending who you are this might be the fun part or the more tedious one. For me it’s interesting because we really want to try and simplify this as much as possible to reduce transaction costs but also to make it so we actually want to use this strategy.
There are Implementation 1 and 2. The really easy way and of course that means signing up for caltropia.com where in the paid plans coming soon these strategies will be available. You would simply click on them and see the allocations and invest accordingly. It will look like below. Easy peasy and very little work on your part, let’s discuss 1 first and then 2.
Implementation 1
In this we simply go to caltropia.com and we would click on the strategy name. In that you would see a version of what is above. However, it will contain the Allocations for EW Managed Futures + Our Mean Reversion Strategy Weights as well.
All you would then do is on rebalance periods, almost always on Fridays to keep it simple. Yes, I’m aware of Staggered Rebalancing etc. However, again I want to keep it as close to simple for everyone and myself as possible. I also tested Staggered Rebalancing here and the results for this aren’t drastically different.
Every Friday, we will go to the site page for our strategy and see the weights. Now for these, you don’t have to use Futures. I do suggest Futures, especially since we’ll be levering up our SPY allocation. You can make it work almost with just ETF’s but again I suggest otherwise.
I assume most have used futures in the past, however, then I’m an ass. So let’s get into why this is challenging and what I can try and do to make it easier for you. Futures have notional values. I.e 1 contract is worth X value. Therefore, to get say a 5% weight of our book in Oil for instance, we would need to calculate the 5% x 100,000 book value and get $5,000 of a position in oil. Then we would need to calculate the notional value of the oil contracts and see how many we can buy to get close to that.
I know, annoying. However, like I said I will try and build something to make it simpler for you all. I could build a spreadsheet quickly before I implement it in the site.
That’s your general implementation for this if following on caltropia.com. If you want to do it yourself. You can do it too, it just requires more work. We will get into that next.
Keep reading with a 7-day free trial
Subscribe to Caltropia Research to keep reading this post and get 7 days of free access to the full post archives.